スマートフォン用FPDコスト分析~Smartphone Display Cost Report 最新刊より
冒頭部和訳
スマートフォン市場の競争は非常に激しく、消費者とセットメーカーは幅広いFPDイノベーションからさまざまな機能を選択し、機能の重要性と価格を照らし合わせて検討する。DSCCが先週発刊した Semi-Annual Smartphone Display Cost Report (一部実データ付きサンプルをお送りします) 最新版では、高リフレッシュレート、高解像度、厚さや重量の改良など、スマートフォン用FPDの主要機能のコストを詳細に解説している。本レポートでは、SamsungのS23シリーズとAppleのiPhone 14シリーズのほか、Samsung、Oppo、Vivo、Xiaomiの最新のフォルダブル型FPDなど、スマートフォンのコストモデルの最新情報を提供している。
本レポートでは中国と韓国の生産ラインを対象に、Q1’23までの稼働率実績と2025年まで稼働率予測を用いている。これまで、リジッド型OLED生産ラインとフレキシブル型OLED生産ラインともに稼働率の低さが根強い問題となっており、今後も続く可能性がある。SDCの生産ラインは、AppleのiPhoneモデルにともなう季節需要に対応し、毎年上半期の稼働率が低く下半期の稼働率が高くなるという持続的なパターンに落ち着いているようだ。
本レポートではDSCCによる各スマートフォン用FPDの推定歩留まりも提示しており、韓国 (SDC) と中国FPDメーカーとの間のギャップは縮小すると予測している。中国FPDメーカーの歩留まりはこれまでに大幅に改善しているが、比較的単純な製品であってもSamsung Displayにまだ遅れをとっている。その一例として、Q2’23のリジッド型6.5インチ FHD+ OLEDの歩留まりは韓国では94%、一方の中国では90%と本レポートでは推定している。
DSCC Smartphone Display Cost Report Highlights Cost of New Technologies
In the immensely competitive smartphone market, consumers and handset makers choose performance features from a vast range of display innovations and weigh the importance of these features against price. The latest update of DSCC’s Semi-Annual Smartphone Display Cost Report (一部実データ付きサンプルをお送りします), released last week gives subscribers a detailed accounting of the cost of key features available in smartphone displays, such as higher refresh rate, resolution or improved thickness and weight. The report includes the latest updates to our smartphone cost model, including revised cost profiles of Samsung’s S23 product line, Apple’s iPhone 14 product line and the latest foldable displays from Samsung, Oppo, Vivo and Xiaomi.
The report uses historical utilization rates up to Q1’23 and our forecast for fab utilization out to 2025 for both China and Korea fabs. Low fab utilization has been a persistent issue with both rigid and flexible OLED fabs, and that is likely to persist. SDC’s fabs appear to have settled into a persistent pattern that follows the seasonal demand for Apple’s iPhone models, with lower utilization in the first half of each year and higher utilization in the second half.
The report also provides DSCC’s estimates of yields for each smartphone panel; we expect a diminishing gap between Korean (SDC) and Chinese panel makers. We have observed that Chinese panel makers have made substantial improvements in yield but remain behind Samsung Display even on relatively simple products. As an example, the report estimates yield on rigid 6.5” FHD+ OLED panels at 94% in Korea in Q2’23, but at only 90% in China.
Along with cost models of many different OLED smartphone panels, the report includes a cost model of an LTPS LCD smartphone panel, for comparison with OLED panels. The first chart here shows the example of a 6.5” FHD+ (2400x1080) 60Hz panel made in China, comparing LTPS LCD with Rigid OLED. Note the difference in vertical scale between the two charts. This analysis demonstrates the challenge faced by OLED panel makers in China to achieve profitability. The price of the LCD panels is ~$4 lower than OLED, but the cost is ~$10 lower than OLED. LCD panels are at breakeven profitability, while OLED panels lose money.
Cost Model for 6.5” FHD+ Panel in China: LCD (L) and OLED (R)
The report includes detailed cost profiles for 45 different smartphone panel types, covering rigid and flexible OLED and one LCD type, including sizes from 5.42” to 8.03”, on suitable production lines in both Korea and China.
This quarter’s update includes profiles of panels with different technology features. Comparisons in the report include:
- Rigid OLED with glass encapsulation vs. rigid OLED panels made on flexible lines with thin film encapsulation (TFE);
- FHD+ resolution (2400x1080) vs. QHD+ resolution (3200x1440) on both LTPS and LTPO panels;
- Add-on Touch vs. integrated touch (YOCTA);
- LTPS backplanes vs. LTPO;
- 60Hz vs. 120Hz LTPS vs. 120Hz LTPO;
- Colorless polyimide (CPI) cover windows vs. ultra-thin glass (UTG);
- Front polarizer vs. color filter on encapsulation (COE).
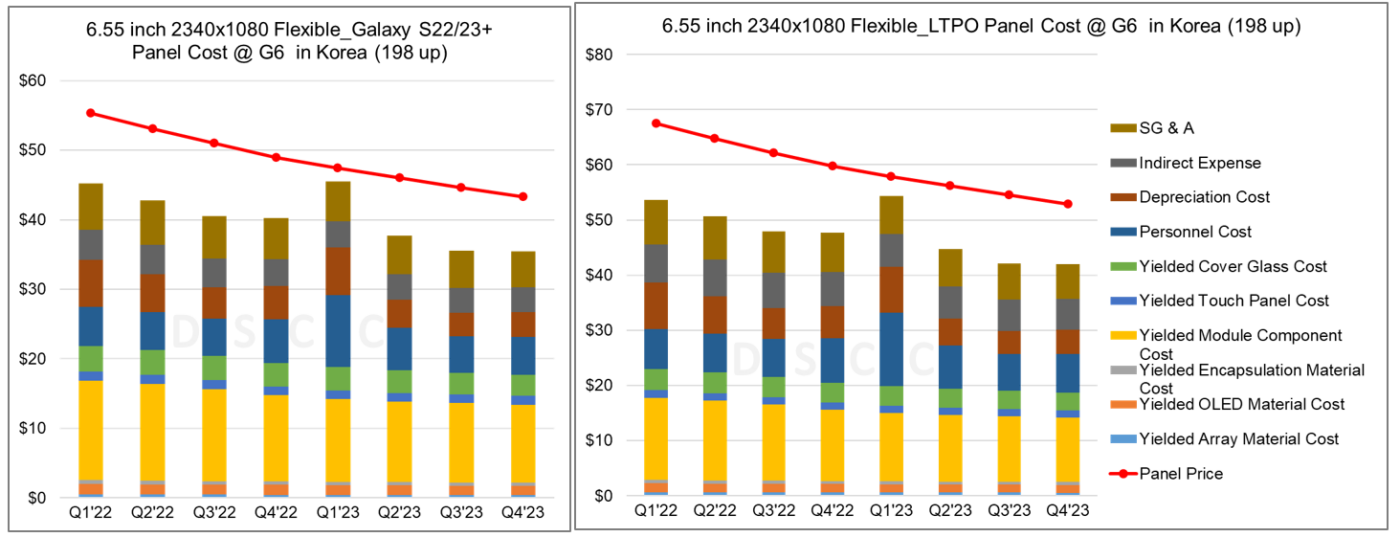
As an example of such a comparison, the report includes cost models for the Samsung S23 series of smartphones, along with variants of the panels on the market to show the impact of technology choices. The next charts here compare the display for the Samsung Galaxy S23+ with a variant using an LTPO backplane. Samsung’s Galaxy S23+ has an LTPS backplane, and the display is unchanged from the S22+. LTPO adds ~$8 to the panel cost and ~$10 to the panel price. The primary value of LTPO is variable refresh rates from 1Hz – 120Hz, an always on display and improved power consumption.
Cost Model for Samsung Galaxy S23+ (L) and Variant with LTPO Backplane (R)
Subscribers to the report can see all the underlying details of these charts – the specific yield assumptions for all the models, the cost detail at a component level and the evolution over time of these factors.
Subscribers to the smartphone cost report receive an Excel worksheet with all the details of the 39 phone models covered, with quarterly cost estimates to 2025, and a PDF with selected cost highlights including the comparisons given above.
本記事の出典調査レポート
Semi-Annual Smartphone Display Cost Report
一部実データ付きサンプルをご返送
ご案内手順
1) まずは「お問い合わせフォーム」経由のご連絡にて、ご紹介資料、国内販売価格、一部実データ付きサンプルをご返信します。2) その後、DSCCアジア代表・田村喜男アナリストによる「本レポートの強み~DSCC独自の分析手法とは」のご説明 (お電話またはWEB面談) の上、お客様のミッションやお悩みをお聞かせください。本レポートを主候補に、課題解決に向けた最適サービスをご提案させていただきます。 3) ご購入後も、掲載内容に関するご質問を国内お客様サポート窓口が承り、質疑応答ミーティングを通じた国内外アナリスト/コンサルタントとの積極的な交流をお手伝いします。


