Q2’24の中国FPDメーカー業績レビュー~大型パネルメーカーが堅調な利益を計上
これらDSCC Japan発の分析記事をいち早く無料配信するメールマガジンにぜひご登録ください。ご登録者様ならではの優先特典もご用意しています。【簡単ご登録は こちらから 】
冒頭部和訳
大型LCD事業を展開する中国の上場FPDメーカー3社がQ2'24決算発表を行い、FPD業界の健全な姿を示す結果となった。各社は価格上昇によって利益を伸ばし、フリーキャッシュフローを生み出している。一方、小型スクリーンに重点を置く中国FPDメーカー3社 (Tianma、EverDisplay、Visionox) は8月30日時点でQ2'24決算発表をまだ行っていない。
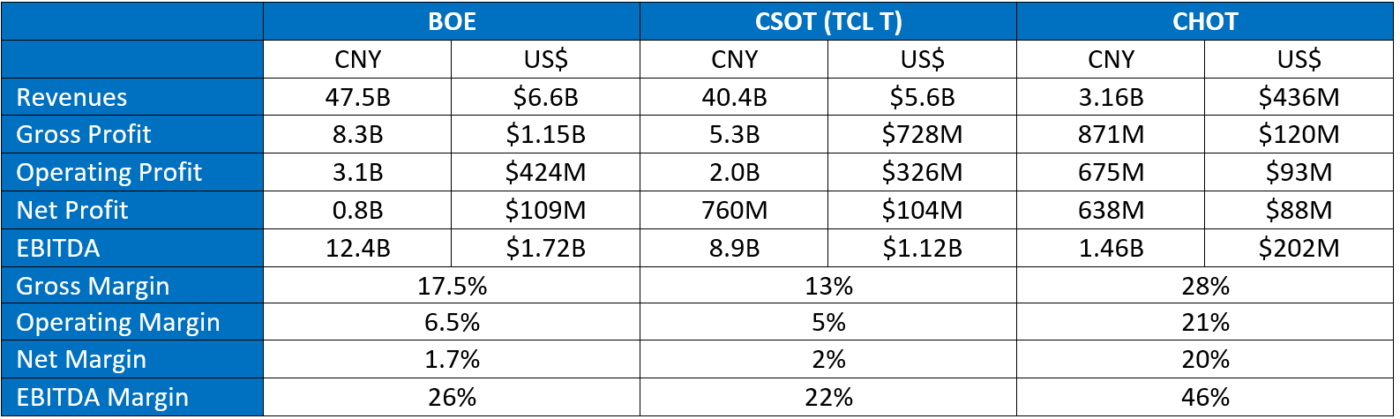
次の表は前述の上場FPDメーカー3社のQ2'24業績概要である。各社の業績詳細は以下をご覧いただきたい。
Q2’24損益計算書ハイライト
Chinese Panel Maker Q2’24 Earnings: Large Screen Makers Solidly Profitable
The three publicly traded panel makers in China with substantial large-screen LCD businesses released their financial reports for the second quarter of 2024 last week, and the results painted a picture of a healthy display industry. The companies rode higher prices to increased profits and are generating free cash flow. Meanwhile, the three Chinese panel makers focused on smaller screens – Tianma, EverDisplay and Visionox – have not yet reported Q2’24 results as of August 30th.
The table here gives a summary of results for these three publicly traded panel makers for Q2’24. Detailed results by company follow.
BOE
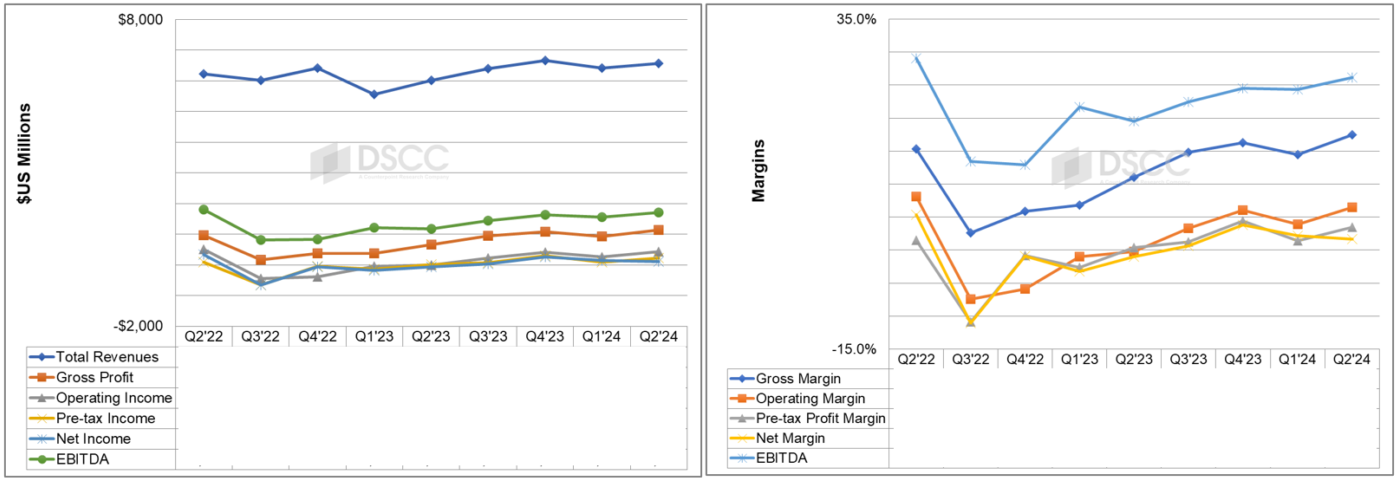
BOE reported a net profit of CNY 0.8B ($109M) on revenues of CNY 47.5B ($6.6B). Revenues were up 2% Q/Q and up 9% Y/Y. BOE reported an operating profit of CNY 3.1B ($424M), compared to an operating profit of CNY 1.8M in Q1'24 and an operating loss of CNY 112M in Q2’23. BOE’s operating profit beat consensus expectations of a profit of CNY2.9B.
BOE reported an asset impairment of CNY 2.1B, listed as a loss on inventory valuation and contract performance loss. BOE net income fell short of consensus analyst expectations of a profit of CNY 1.4B, and revenue fell just short of consensus expectations of CNY 48.7B. EBITDA was CNY 9.8B, down 13% Q/Q but up 15% Y/Y and 25% lower than consensus expectations of CNY 13.0B.
Corporate gross margin increased from 15% in Q1'24 to 18% in Q2'24 and this was an improvement Y/Y from 11% in Q2'23. Operating margin improved Q/Q from 4% to 7% and net margin worsened Q/Q from 4% to 2% and EBITDA margin worsened by two points Q/Q to 23%.
BOE Income Statement and Margins
BOE inventory increased by 8% Q/Q and inventory days increased Q/Q from 56 to 60. BOE continues to hold a substantial cash reserve, and cash increased 10% Q/Q and 20% Y/Y to CNY 90.6B ($12.5B). BOE debt increased by 2% Q/Q to CNY 146B, and equity increased 1% Q/Q to CNY 201B, so debt/equity edged up from 72% to 73% while net debt/equity decreased from 31% to 28%.
BOE reported cash flow from operations of CNY 8.6B ($1.2B), down 47% Q/Q but up 41% Y/Y. BOE depreciation in the first half of 2024 was CNY 18.8B, an increase from 17.0B in the first half of 2023. BOE capex in the quarter was CNY 7.3B ($1.01B), up 47% Q/Q and up 35% Y/Y. BOE reported positive free cash flow of CNY 1.3B ($182M), the sixth consecutive quarter of positive FCF.
BOE reported that 83.5% of revenues in 1H'24 came from its Display Devices business, and an additional 4.32% came from its MLED business which supplies LEDs. BOE display revenues in Q2'24 were CNY 39.7B ($5.48B), up 4% Q/Q and up 11% Y/Y. BOE's gross margin in displays was 14% in 1H'24, compared to 6% in 2H'23 and 0% in 1H'23.
CSOT (TCL Technologies)
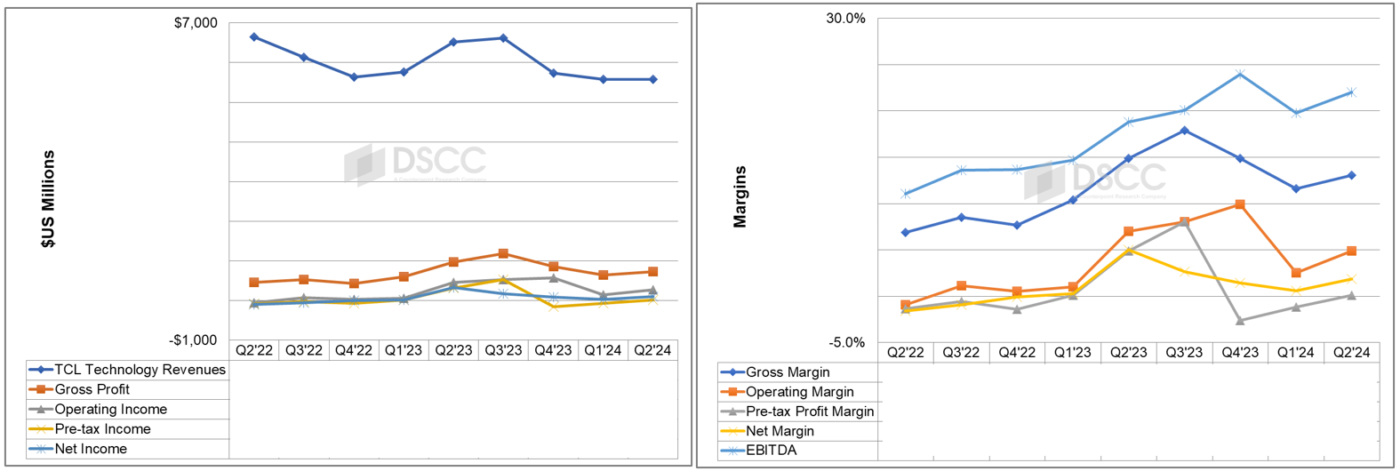
At a corporate level, TCL Technologies reported a net profit available to common stockholders in Q2’24 of CNY 760M ($104M) on revenues of CNY 40.4B ($5.6B). Net income fell short of consensus expectations of CNY 1.39B and revenues fell short of consensus expectations of CNY 45.8B. Revenues were flat Q/Q and down 15% Y/Y in $US. Net income increased by 211% Q/Q but decreased by 68% Y/Y. TCL EBITDA was CNY 8.9B ($1.23B) in Q2'24, 9% better than consensus expectations of CNY 8.1B.
All TCL margins improved Q/Q by between 1%-3%. TCL gross margin increased from 12% in Q1'23 to 13% in Q2'24 while TCL's operating margin increased from 2.5% in Q1'24 to 4.9% in Q2'24. Net margin increased Q/Q from 0.6% to +1.9% and EBITDA margin increased Q/Q from 20% to 22%.
TCL Technology Income Statement and Margins
TCL inventory increased 5% Q/Q and inventory days increased from 50 to 52. TCL debt was flat Q/Q while equity decreased 5% Q/Q. Debt/equity increased from 98% to 102% and net debt/equity increased from 64% to 70%.
TCL capital expenditures in Q2'24 were CNY 5.7B ($792M). TCL reported cash flow from operations of CNY 6.0B, down 8% Q/Q but up 2% Y/Y. Free cash flow continued positive at CNY +303M ($42M). This was the fourth consecutive positive quarter of FCF after six consecutive quarters of negative FCF.
In the first half of 2024, display revenues were 62% of TCL Technology corporate revenues, an increase from 45% in 2H'23.
TCL display revenues in Q2'24 were CNY 25.1B ($3.5B), flat Q/Q but up 19% Y/Y. TCL display gross margin in Q2'24 was 19%, compared to 5% in 2H'23 and 5% in 1H'23.
CHOT (Caihong Display)
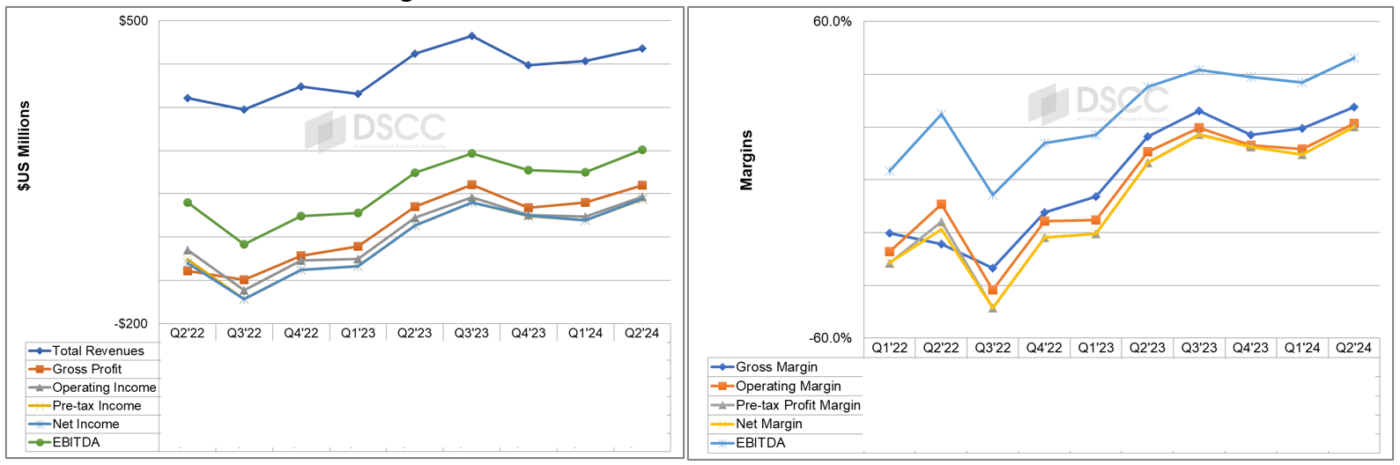
CHOT reported a net profit of CNY 638M ($88M) on revenues of CNY 3.2B ($436M). Revenues were up 7% Q/Q and 3% Y/Y. CHOT reported an operating profit of CNY 675M ($93M), compared to an operating profit of CNY 337M in Q1'24 and an operating profit of CNY 318M in Q2'23. This was the fifth consecutive quarter of operating profits and net profits after six consecutive quarters of operating and net losses for CHOT.
Margins were better Q/Q by 8%-12% and Y/Y by 11%-14%. Gross margin increased from +20% in Q1'24 to +28% in Q2'24. This compares with 17% in Q2'23. Operating margin improved Q/Q from +11.5% to +21.4%, compared to 11% in Q2'23.
EBITDA margin continued to be strong at +46%, up from +37% in Q1'24 and up from 35% in Q2'23.
CHOT Income Statement and Margins
Caihong’s Inventory increased by 2% Q/Q and inventory days increased from 37 to 39. CHOT debt increased by CNY 300M ($32M including FX changes) while equity increased by 3% Q/Q. Debt/equity was stable Q/Q at 48% and net debt/equity decreased from 18% to 14%.
CHOT reported positive cash flow from operations of CNY 0.9B ($118M), down 35% Q/Q but up 89% Y/Y. Free cash flow turned negative at CNY -20M (-$3M), which followed three consecutive quarters of positive FCF. CHOT capital expenditures in Q2'24 were CNY 878M ($120M).