Q2’24のFPD用ガラス市場は急成長を記録、下半期は一転減少の見通し
出典調査レポート Quarterly Display Glass Report の詳細仕様・販売価格・一部実データ付き商品サンプル・WEB無料ご試読は こちらから お問い合わせください。
これらDSCC Japan発の分析記事をいち早く無料配信するメールマガジンにぜひご登録ください。ご登録者様ならではの優先特典もご用意しています。【簡単ご登録は こちらから 】
記事のポイント
- Q2’24のFPD用ガラス出荷 (面積ベース) は前期比12%増、前年比5%増となった。
- FPD用ガラス需要における中国のシェアはQ2’24に過去最高の73%を記録した。
- 出荷増と価格上昇により、2024年のFPD用ガラス出荷額は日本円換算で13%増になると予測される。
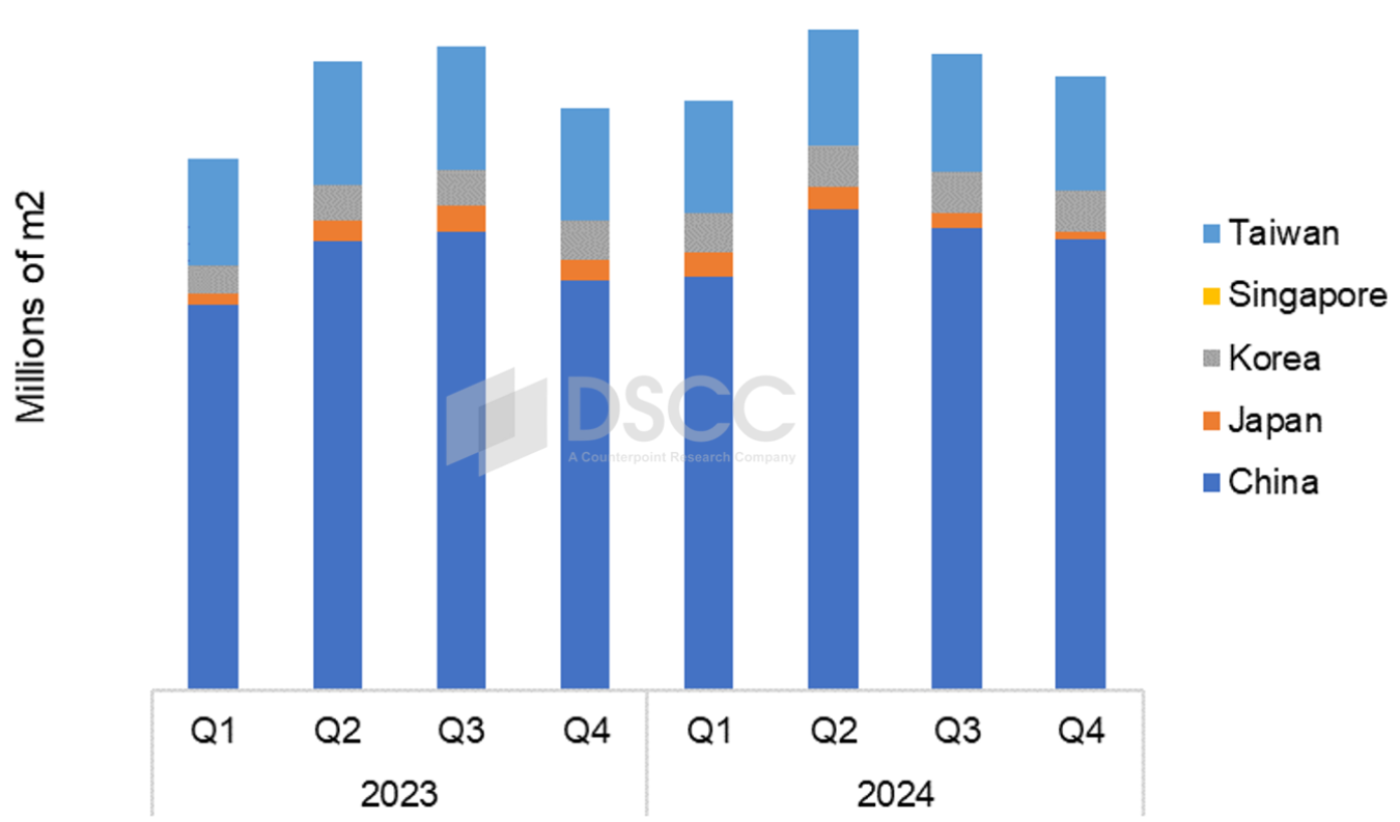
DSCCが先週発刊した Quarterly Display Glass Report 最新版によると、ガラスメーカーのQ2’24のFPD用ガラス出荷面積は前期比12%増、前年比5%増の1億7200万㎡だった。世界のFPD用ガラス需要における中国のシェアはQ2’24に過去最高の73%に達している。中国国外では最大であるSharpの堺ディスプレイプロダクトの第10世代生産ラインの閉鎖にともない、FPD用ガラス需要における中国のシェアは今後さらに高まる見通しだ。しかしQ3’24のFPD用ガラス出荷面積は前期比4%減、Q4'24にはさらに前期比4%減が予測されている。
Quarterly Display Glass Report ではすべてのLCDおよびOLED生産ラインを対象に、主要ガラスメーカー全社のガラス能力と出荷を追跡している。同レポートはDSCCが持つFPD業界の能力と稼働率に関する包括的インサイトとFPD用ガラスとそのサプライチェーンに関する深い理解を組み合わせたものであり、FPD用ガラス生産4ヵ国 (日本、中国、台湾、韓国) それぞれの能力を概説するとともに、第1世代から第10.5世代までガラス出荷を追跡している。さらに、FPD業界向けの3大サプライヤーであるCorning、AGC、NEGと、その他のガラスメーカーからのガラス出荷について詳しく解説している。レポートには、FPDメーカー26社を対象とした調達相関図も掲載している。
今期は中国国内のガラスメーカーに関する新たな情報を加えてガラス生産能力予測を更新している。中国国内ガラスメーカーは2023年から2024年にかけて第8.5世代能力を追加している。Corningの複数ラインの再開とCaihong/Iricoの追加により、Q2’24のFPD用ガラス業界の生産能力は前期比2%増となった。
市場を地域別に見ると、中国系パネルメーカーがFPD業界を支配しており、FPD用ガラス市場における韓国の影響力が縮小していることがわかる。Samsung DisplayとLG DisplayはともにOLEDにシフトしLCDラインを閉鎖したため、韓国における両社のFPD生産能力は縮小、ガラス需要はそれ以上に減少している。2017年以降に追加されたOLED生産能力はいずれも必要なガラスが1枚で、対するLCDはガラスが2枚必要なためである。10年前、韓国はガラス需要の最大地域だったが、SamsungとLGの両社が低稼働率で推移していることから、韓国のシェアはQ1’23にガラス市場のわずか5%という低水準を記録している。
レポートにはa-SiガラスとLTPSガラスの基板サイズ別価格表を掲載している。ガラス価格は業界全体で日本円表示としており、FPD業界のガラス価格は数量や顧客によって異なるが、レポートでは平均価格を提示している。
Corningは2023年5月に値上げを発表、Q4'23には円ベースで2桁の値上げを行ったことを発表した。ガラス平均価格はQ1'24とQ2'24ともに前期比横ばいで推移しており、Q3'24も横ばいが続くと推測されるが、Corningは円安を考慮したガラス値上げの強硬姿勢を示唆している。Q4'24のガラス価格は10%上昇となる見通しだ。DSCCでは2024年FPD用ガラス出荷額は円ベースで13%増と予測しているが、平均為替レート147円/ドルで算出した米ドルベースでは8%増となる。
------------------------------------
DSCCの Quarterly Display Glass Report はすべてのLCDおよびOLED生産ラインを対象に主要ガラスメーカー全社のガラス能力と出荷を追跡しており、地域/FPDメーカー/バックプレーンタイプ/基板サイズなどの項目別にデータを表示できるピボットテーブルを提供しています。第1世代から第10.5世代までのa-SiガラスとLTPSガラスの価格データのほか、Q1’19からの四半期実績とQ4’24までの予測を掲載しています。
出典調査レポート Quarterly Display Glass Report の詳細仕様・販売価格・一部実データ付き商品サンプル・WEB無料ご試読は こちらから お問い合わせください。
[原文] Display Glass Market Jumped in Q2 But Falling in 2H’24
- Display glass shipments increased 12% Q/Q and 5% Y/Y in Q2’24.
- China’s share of the display glass market matched its all-time high of 73% in Q2’24.
- With increases in shipments and price, display glass revenues are expected to increase 13% in 2024 in terms of Japanese yen.
Glass makers shipped 172M m2 of display glass in Q2’24, an increase of 12% Q/Q and 5% Y/Y according to the latest update to DSCC’s Quarterly Display Glass Report, released last week. China’s portion of worldwide display glass demand increased to an all-time high of 73% in Q2’24. With the coming closure of the largest fab outside China, Sharp’s Sakai Display Products Gen 10, China’s share of display glass demand will only increase. Glass shipments are expected to decrease by 4% Q/Q in Q3’24 and to decrease another 4% Q/Q in Q4’24.
The Quarterly Display Glass Report tracks glass capacity and shipments for all major glass makers across all LCD and OLED display fabs. The report combines DSCC’s comprehensive insight into industry capacity and utilization with an in-depth understanding of display glass and the supply chain. The report outlines capacity by region in each of the four regions of display glass production: Japan, China, Taiwan and Korea, and covers glass shipments in Gen sizes from 1 to 10.5. The report details glass shipments for the three major suppliers to the display industry, Corning, AGC and NEG, along with other glass suppliers. The report includes a supply matrix covering 26 panel makers.
We have updated our glass capacity outlook with new intelligence this quarter on domestic Chinese glass makers. Domestic Chinese glass makers have been adding Gen 8.5 capacity in 2023-2024. Industry Capacity for display glass increased by 2% Q/Q in Q2’24 with some restarts by Corning and additions by Caihong/Irico adding to industry output.
A view of the market by region demonstrates the dominance of the display industry by China panel makers and the shrinking relevance of Korea in the display glass market. As both Samsung Display and LG Display have shifted to OLED and closed LCD lines, their total display capacity in Korea has been reduced and their glass demand has been further reduced because all the OLED capacity added since 2017 requires only one piece of glass whereas LCD requires two. Ten years ago, Korea was the largest region for glass demand, but Korea’s share hit a low point of only 5% of the glass market in Q1’23 with both Samsung and LG running at low utilization.
The report provides tables of glass prices by Gen size for a-Si and LTPS glass. Glass is priced in Japanese yen across the industry, and while glass prices in the display industry vary by volume and by customer, the report provides average prices.
Corning announced a price increase in May 2023, and by Q4’23 Corning declared that it had succeeded in implementing a double-digit price increase (in yen terms). We estimate that average glass prices have been flat Q/Q in both Q1 and Q2’24 and will continue to be flat in Q3’24, but Corning has signaled strongly that it will increase prices on glass to account for the weakening of the yen. We forecast a 10% increase in glass prices in Q4’24. DSCC forecasts that display glass revenues are expected to increase 13% in yen terms in 2024, but this translates to only an 8% increase in US$ terms based on an average exchange rate of ¥147/$.
DSCC’s Quarterly Display Glass Report tracks glass capacity and shipments for all major glass makers across all LCD and OLED display fabs, providing pivot tables that allow splits by region, panel maker, backplane type and TFT Gen Size. The report includes prices for a-Si and LTPS glass for Gen Sizes from 1 to 10.5 and includes quarterly history from Q1’19 and a forecast through Q4’24.

