FPD生産ライン稼働率がQ3'24に低下、再び供給過剰に
出典調査レポート Quarterly All Display Fab Utilization Report の詳細仕様・販売価格・一部実データ付き商品サンプル・WEB無料ご試読は こちらから お問い合わせください。
これらDSCC Japan発の分析記事をいち早く無料配信するメールマガジンにぜひご登録ください。ご登録者様ならではの優先特典もご用意しています。【簡単ご登録は こちらから 】
冒頭部和訳
- Q3'24の業界全体の稼働率は前期比で3%低下の見込み。
- 需要低迷のなか、LCDメーカー各社は過剰在庫の積み増しを避けるため、生産ペースを落としている。
- OLEDが大半を占める韓国の稼働率は、スマートフォンやTVの季節需要を支えるため、前期比で上昇の見込み。
FPD業界は予想以上に好調だった春季の四半期の後、夏季に入って減速しており、低迷は年末まで続くと予測される。DSCCが発刊した Quarterly All Display Fab Utilization Report で明らかにしている。川下のFPDサプライチェーン在庫は一杯になっており、ホリデーシーズンまで明確な需要促進要因がないため、業界の供給能力は需要をはるかに上回っている。LCDメーカー各社は過剰在庫の積み増しを避けるため、Q3'24は賢くブレーキを踏んでいるようだ。
Display Industry Oversupply Returns as Fab Utilization Decreases in Q3’24
- Total industry utilization is expected to decline 3% Q/Q in Q3’24.
- LCD makers are slowing down to avoid building excess inventory amid demand weakness.
- Utilization in Korea, which is mostly OLED, will increase Q/Q to support seasonal demand for smartphones and TVs.
After a stronger than expected spring quarter, the display industry is slowing down in the summer months, and we expect the slowdown to continue through the end of the year, according to the latest release of DSCC’s Quarterly All Display Fab Utilization Report issued. Inventory in the downstream display supply chain has been filled, and with no clear demand drivers until the holiday season the supply capacity of the industry far exceeds demand. LCD makers appear to be wisely tapping on the brakes in Q3’24 to avoid building excess inventory.
After a slowdown over Q4’23 to Q1’24, total TFT input for all display makers in Q2’24 was up 12% Q/Q and up 6% Y/. In the current Q3’24, we expect total TFT input to be down 3% Q/Q and flat Y/Y. Heading towards year-end, we expect that TFT input will continue downward, dropping 4% Q/Q in Q4’24, which would be a Y/Y increase of 6%.
The report details monthly capacity, TFT input and utilization for every flat panel display fab in the industry, more than 100 fabs in all, and includes pivot tables to allow segmentation by the supplier, country, TFT fab generation, backplane, frontplane or substrate type. The report provides historical utilization back to Q1’19 and a forecast by month for all of 2024.
As we have reported, LCD TV panel prices peaked in May/June and began declining in July, a demand signal that appears to be guiding panel makers to slow down utilization in Q3.
TFT Quarterly Fab Utilization by Region
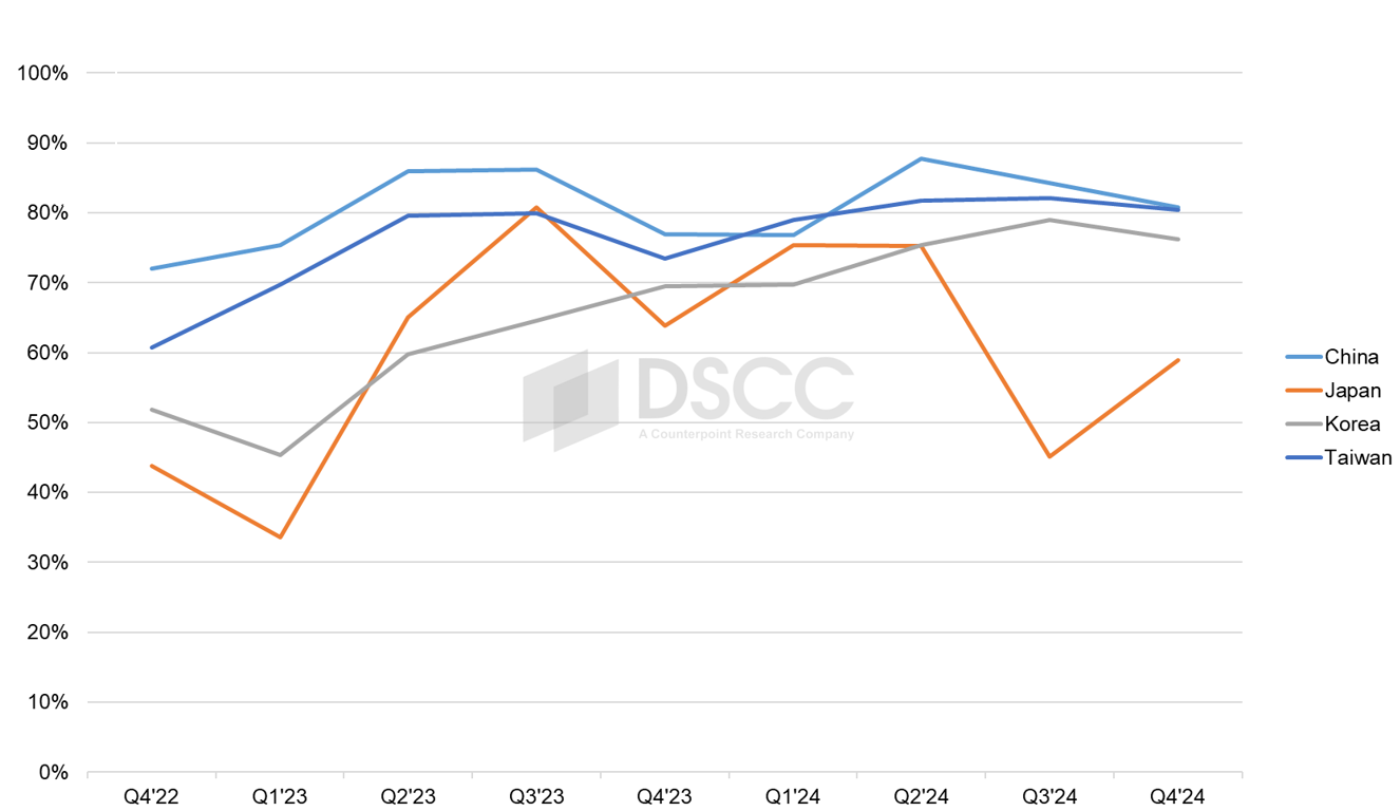
As shown in the chart, the slowdown has started in China, which represents 70% of industry capacity, but is not apparent in Taiwan or Korea. Taiwan utilization of 82% in Q3 is flat on a sequential basis, and Korea utilization has increased.
Although the chart by region shows Japan with a much more volatile pattern and Taiwan with a smoother pattern, those two regions follow the general trend set in China, which sets the pattern for the industry because it dominates LCD capacity. Korea does not follow the same pattern – it increased UT% in Q4’23 when all other regions were decreasing, and it is increasing again in Q3’24 when other regions are flat or decreasing. The Korea utilization pattern depends more closely on demand for OLED panels, since 62% of capacity in Korea is OLED. Utilization in Q3 is increasing with the normal seasonal increase in demand for smartphone panels, combined with a seasonal increase in OLED TV panels as we approach the holiday selling season.
Looking more closely at LCD, a view of utilization by manufacturer by month shows the slowdown in Q4’23 which extended into Q1’24 with the recovery effectively starting in March. The biggest beneficiary of the Q2’24 demand bump was China Star, whose utilization surpassed 95% in May and June while no other panel maker reached 90%. At the other end of the scale was Innolux, whose utilization remained in the low 80s in Q2.
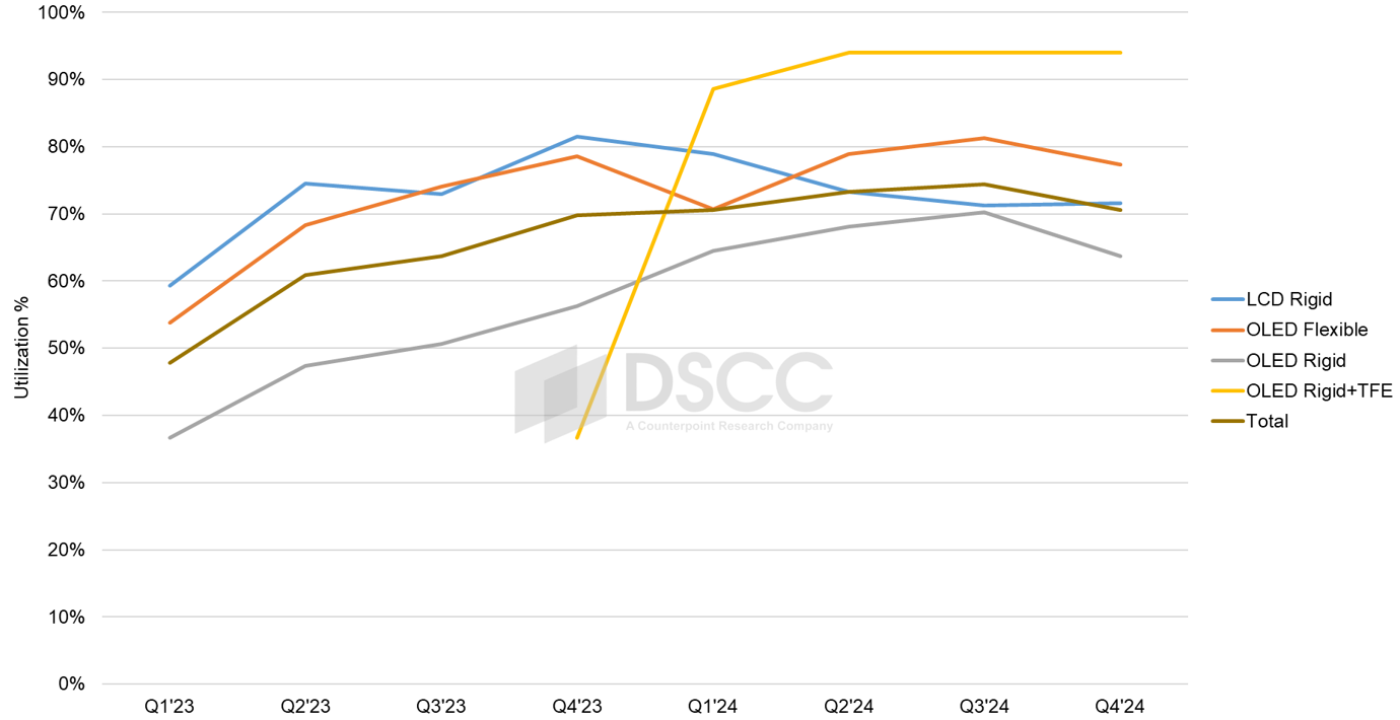
As compared to the larger-screen categories, with a clear downturn in Q4’23 to Q1’24, the Mobile IT sector has largely been recovering continuously in 2023 and 2024 from the last severe slowdown which hit bottom in Q1’23. Rigid OLED is enjoying a strong recovery in 2024 because of increased demand for rigid OLED panels for smartphones, which is happening at the expense of LTPS LCD. The new Rigid + TFE category is running at a very high UT% to satisfy OLED IT panel demand.
Quarterly TFT Utilization by Display Technology and Substrate
After suffering its worst downturn in more than a decade, the industry has recovered in 2023 and 2024. However, industry capacity continues to far outstrip demand for displays, so utilization needs to be adjusted dynamically to the seasonal changes in demand.
For more information on DSCC’s fab utilization reporting, please see its Quarterly All Display Fab Utilization Report.
出典調査レポート Quarterly All Display Fab Utilization Report の詳細仕様・販売価格・一部実データ付き商品サンプル・WEB無料ご試読は こちらから お問い合わせください。