FPD生産能力予測~OLEDは中国が2028年に韓国を、フレキシブルOLEDはBOEがSDCを追い抜く
出典調査レポート Quarterly Display Capex and Equipment Market Share Report の詳細仕様・販売価格・一部実データ付き商品サンプル・WEB無料ご試読は こちらから お問い合わせください。
これらDSCC Japan発の分析記事をいち早く無料配信するメールマガジンにぜひご登録ください。ご登録者様ならではの優先特典もご用意しています。【簡単ご登録は こちらから 】
FPD生産能力最新予測~OLED生産能力は中国が2028年に韓国を、フレキシブルOLED生産能力はBOEがSDCを追い抜く
- FPD生産能力予測は若干引き上げ、2023年-2028年の年平均成長率は依然2%未満の見込み。
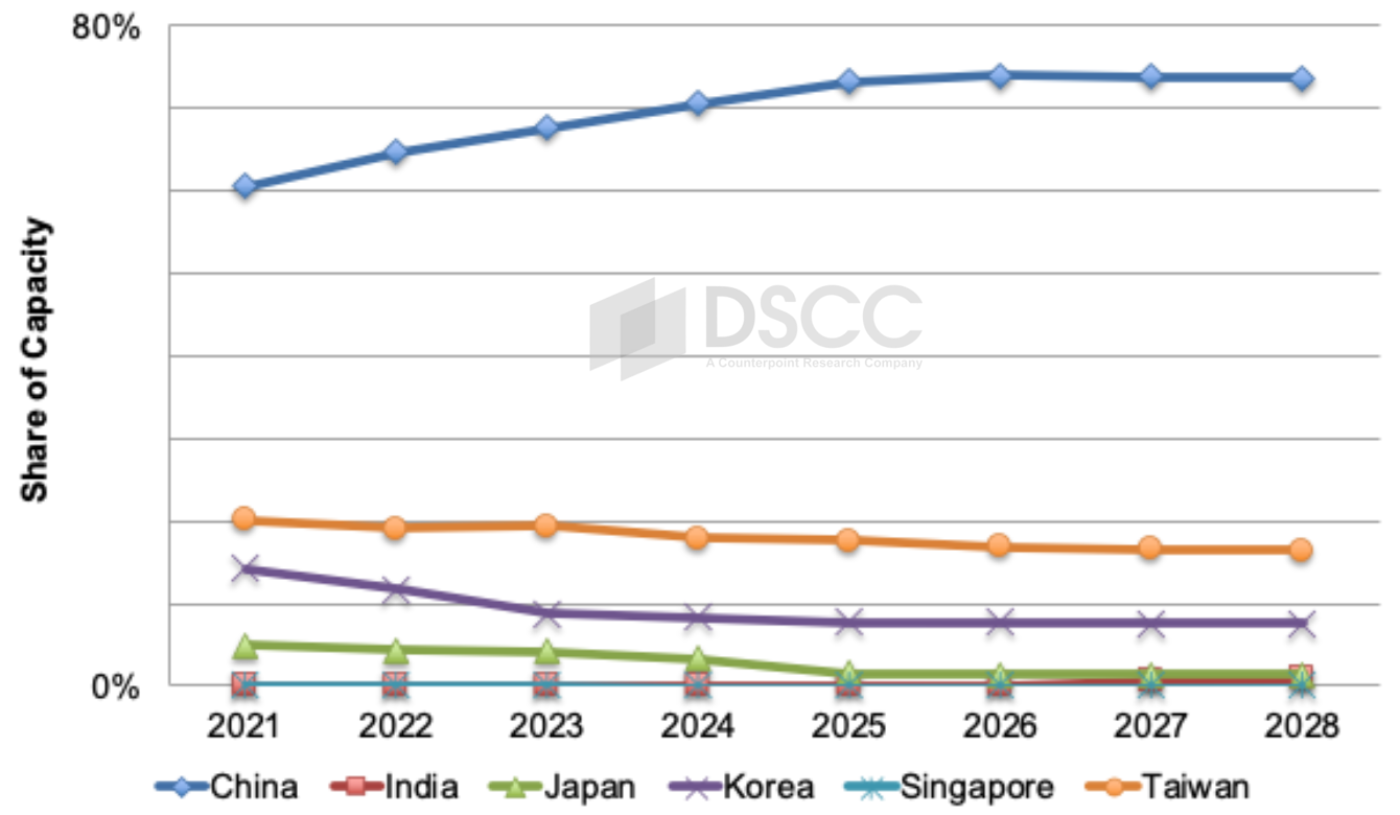
- 中国のシェア拡大が続き2026年には74%到達の見込み。中国は2028年にOLED生産能力で韓国を追い抜くと見られる。
- BOEは2028年にフレキシブルOLED生産能力でSDCを追い抜く見通し、B16が貢献する。
DSCCが定期発行する好評の Quarterly Display Capex and Equipment Market Share Report で、最新の生産ライン計画に基づいたFPD設備投資および生産能力の実績および予測に関する最新情報を提供している。DSCCでは、FPD生産能力は2023年から2028年にかけて年平均成長率1.4%で増加、LCDは年平均成長率わずか1%、OLEDは年平均成長率4.8%と予測している。両数値とも前期より若干引き上げとなっている。
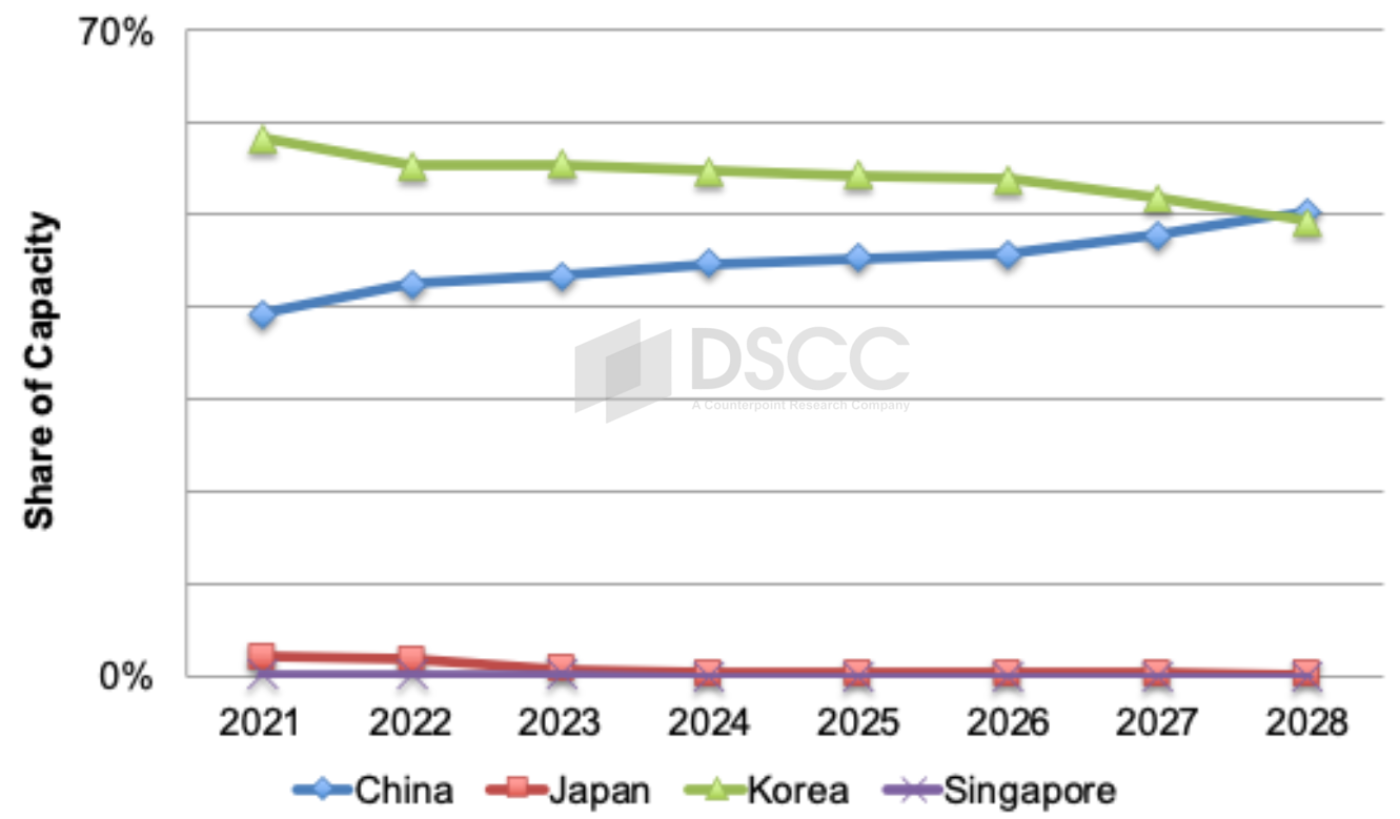
FPD生産能力全体に占める中国のシェアは2023年の68%から2028年には74%に上昇し、年平均成長率3%で成長する。日本、韓国、台湾の生産能力は絶対値ベースでは縮小する見通しで、インドは最終的に生産ラインが1つ稼動に入れば若干の成長が見込まれる。LCDだけを見ると、中国のシェアは2023年の70%から2028年には76%となる。OLEDについては、中国が2023年-2028年の年平均成長率8%で2028年にはOLED生産能力で韓国を追い抜く見通しで、年平均成長率2%見通しの韓国に対し、4倍の速さで成長すると予測されている。
大型パネルの生産能力に限ると、第7世代以上の生産能力は2023年-2028年の年平均成長率がわずか2%となる見通しだ。2018年から2022年までは少なくとも年率7%の成長を遂げたが、その後の2023年には市場の低迷による生産ラインの遅延と閉鎖によって生産能力は1%減少した。2024年にはSDPの閉鎖があるものの3%の成長が見込まれ、その後2026年から2028年にかけては1%-3%の成長が続く見通しだ。生産能力の伸びが限定的であることから、平均サイズ拡大の継続と同時にTV需要が急増すれば、大幅な供給不足に陥る可能性がある。中国が何らかの補助金制度を通じてTV需要の喚起を試みれば、これは現実に起こり得る。今後、需要が供給に近づき、中国と台湾のFPDメーカーだけがTV用LCDを生産するようになれば、ブランド各社は著しく不利になり、FPDメーカーにとってはより健全な環境になることも考えられる。
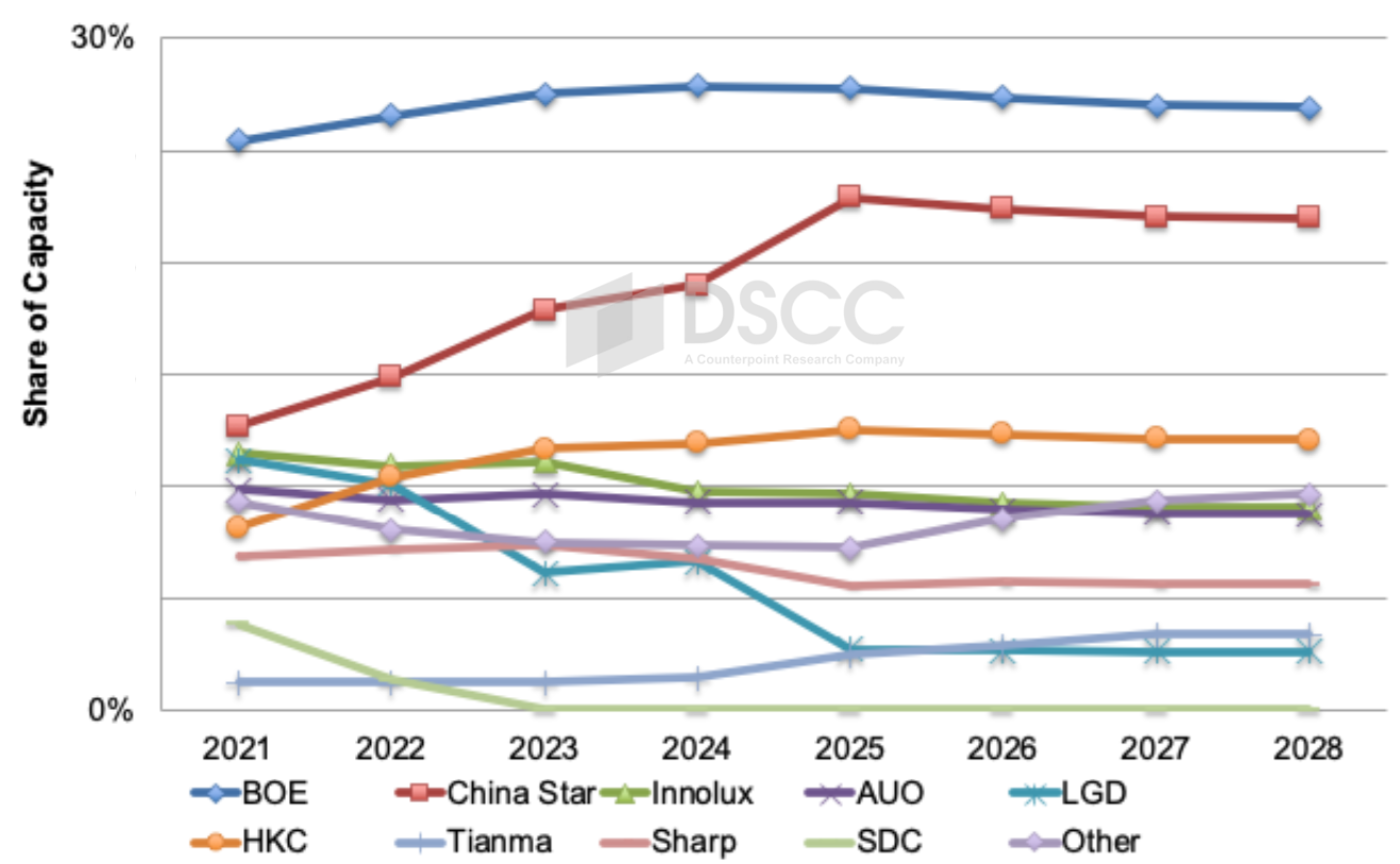
FPD生産能力シェアでは、BOEが依然として大きくリードしており、次いでChina Starが続く。2023年はBOEがシェア26%、China Starがシェア17%だったが、2028年にはBOEがシェア25%、China Starがシェア18%となり、現在のところリードは縮小の方向だ。LCD生産能力シェアを見ても同様で、BOEのChina Starに対するリードは2023年の28% vs. 18%から2028年には27% vs. 20%へとわずかに縮小する。ただし、China Starが予想通りLGDの中国LCD生産ラインを買収することになれば、China StarのLCD生産能力シェアは2025年に23%へと急上昇し、2025年-2028年のBOEのリードはわずか5ポイントとなるが、買収が実現しなければ、リードは7ポイントから8ポイントとなる。
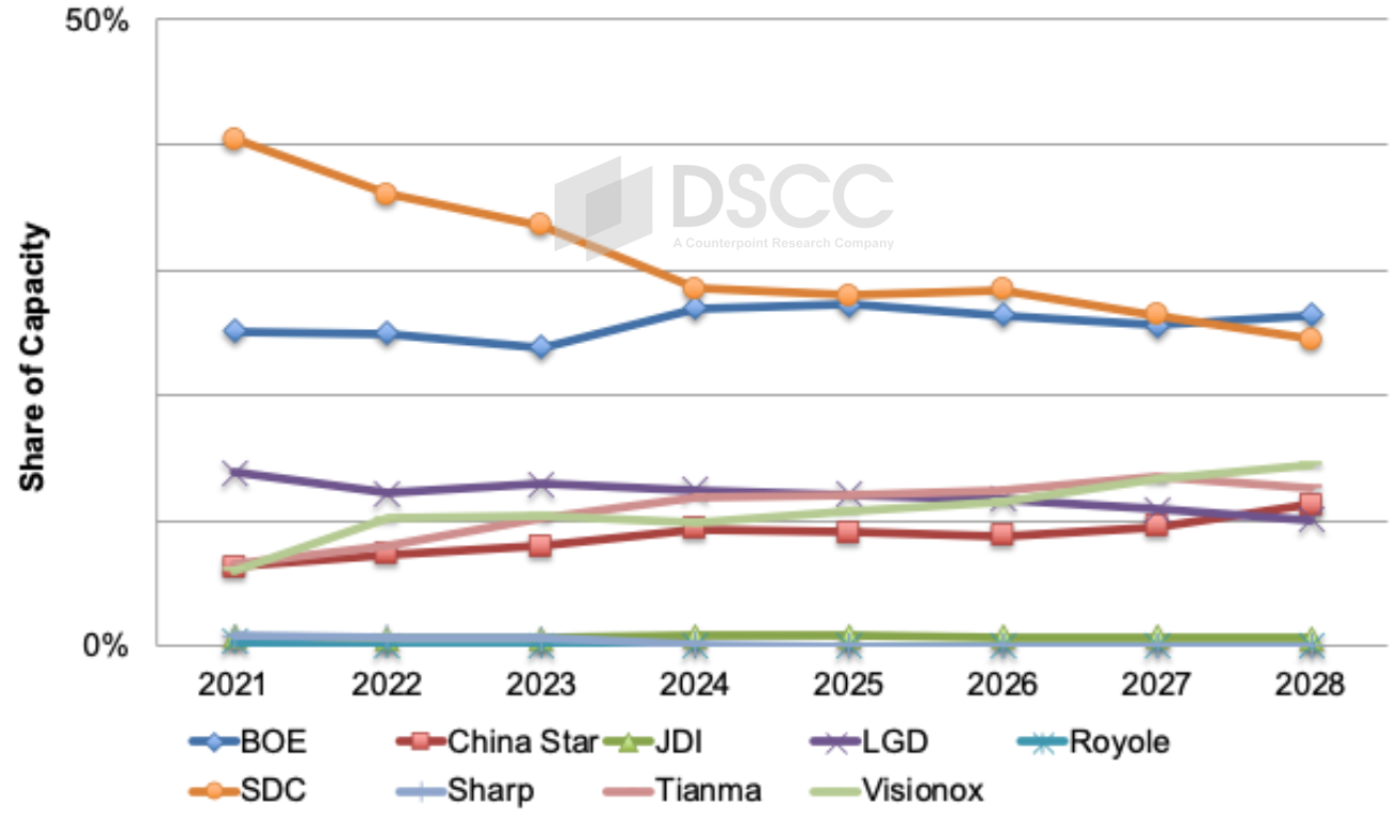
OLED生産能力については、2023年から2028年まではSDCとLGDの2強状態で、LGDが2ポイントから5ポイントのリードを維持する。モバイル/IT用の生産能力を見ると、A2が含まれるためSDCのBOEに対しするリードは大きくなる。フレキシブルOLEDの生産能力については、BOEが2028年にSDCを26% vs. 24%で追い抜くと予測されるが、これは第8.7世代生産能力の一部をフレキシブル基板に割り当てるB16の貢献による。2028年のフレキシブルOLED生産能力ではVisionoxがシェア14%で第3位に浮上する見通しだ。
------------------------------------
本レポートではこの他、日本、韓国、台湾の生産ライン閉鎖の最新状況と予測を提示するとともに、用途、基板、世代などの項目別の詳細も掲載しています。FPD生産能力の詳細については Quarterly Display Capex and Equipment Market Share Report をご覧ください。
出典調査レポート Quarterly Display Capex and Equipment Market Share Report の詳細仕様・販売価格・一部実データ付き商品サンプル・WEB無料ご試読は こちらから お問い合わせください。
[原文] DSCC Reveals Latest Display Capacity Outlook - China Expected to Overtake Korea in OLEDs in 2028, BOE Overtaking SDC in Flexible OLED Capacity
- Display capacity revised up slightly, still growing at less than a 2% CAGR from 2023 to 2028.
- China continues to gain share, expected to reach 74% from 2026. China expected to overtake Korea in OLED capacity in 2028.
- BOE expected to overtake SDC in flexible OLED capacity in 2028 helped by B16.
DSCC’s highly popular Quarterly Display Capex and Equipment Market Share Report reveals the latest display equipment spending and capacity results and forecasts based on the latest fab schedules. DSCC expects display capacity to rise at a 1.4% CAGR from 2023 to 2028, with LCDs growing at just a 1% CAGR and OLEDs growing at a 4.8% CAGR. Both numbers are up slightly vs. last quarter.
We continue to see China gaining ground with their share of total display capacity rising from 68% in 2023 to 74% in 2028, growing at a 3% CAGR. Japan, Korea and Taiwan are all expected to see their capacity shrink in absolute terms with India seeing some growth if a fab eventually comes online. Looking just at LCDs, we see China with a 76% share in 2028, up from 70% in 2023. In OLEDs, we now see China overtaking Korea in OLED capacity in 2028, growing at a 4x faster growth rate at an 8% CAGR from 2023 to 2028 vs. Korea at a 2% CAGR.
Looking just at larger panel capacity, G7+ capacity is only expected to rise at a 2% CAGR from 2023 to 2028. After at least 7% growth annually from 2018 to 2022, capacity declined by 1% in 2023 on fab delays and closures on weak market conditions. 3% growth is expected in 2024 despite SDP’s closure followed by 1-3% growth from 2026-2028. Given the limited capacity growth, a surge in TV demand along with the continued increase in average size could result in a significant shortage. If China tried to stimulate TV demand through some sort of subsidy program, this could become a reality. As demand approaches supply in the future and only Chinese and Taiwan suppliers making LCD TV panels, brands could be at a significant disadvantage resulting in a healthier environment for panel suppliers.
In terms of display capacity share, we still see BOE with a significant lead followed by China Star. The lead currently narrows from a 26% share for BOE and a 17% share for China Star in 2023 to 25% for BOE and 18% for China Star in 2028. Looking at LCD capacity share, it is a similar story with BOE’s advantage over China Star shrinking slightly from 28% to 18% in 2023 to 27% to 20% in 2028. However, if China Star ends up buying LGD’s LCD fab in China as expected, then China Star’s LCD capacity share surges to 23% in 2025 and BOE’s advantage holds at just five points from 2025-2028 vs. seven to eight points otherwise.
In the case of OLED capacity, it is a two-horse race between SDC and LGD with LGD holding a two-to-five-point advantage from 2023 to 2028. Looking at mobile/IT capacity, SDC holds a wide advantage over BOE due to the inclusion of A2. In flexible OLED capacity, BOE is expected to overtake SDC in 2028 with a 26% to 24% advantage helped by B16 allocating some of its G8.7 capacity to flexible substrates. Visionox is expected to rise to #3 in flexible OLED capacity in 2028 with a 14% share.
The report also highlights the latest and projected fab closures in Japan, Korea and Taiwan and reveals breakouts by application, substrate, fab generation and more. For more information on display capacity, please see our Quarterly Display Capex and Equipment Market Share Report.

