FPD生産ライン稼働率、2024年下半期は抑制傾向
出典調査レポート Quarterly All Display Fab Utilization Report の詳細仕様・販売価格・一部実データ付き商品サンプル・WEB無料ご試読は こちらから お問い合わせください。
これらDSCC Japan発の分析記事をいち早く無料配信するメールマガジンにぜひご登録ください。ご登録者様ならではの優先特典もご用意しています。【簡単ご登録は こちらから 】
記事のポイント
- FPDメーカーの生産ライン稼働率はQ2'24にピークを迎え、Q3’24はやや低下した。
- Q3’24にはスマートフォンやTVの需要回復にともない、OLED生産ライン稼働率が前期比で上昇した。
- Q4'24はLCD、OLEDともに供給過剰に対処するため稼働率が低下すると見られる。
DSCCが今月発刊した Quarterly All Display Fab Utilization Report によると、春から夏にかけて緩やかに上昇したFPD生産ライン稼働率はQ3’24に下がり始め、Q4’24はさらに低下している。FPDメーカーは供給過剰と在庫積み増しを避けるため、稼働率をコントロールしているようだ。
Q2’24は稼働率が緩やかに回復したが、これは夏のスポーツイベント (ユーロ2024、パリ五輪) によるTV需要やAI搭載PCが促進するPC買い替えサイクルなどのIT需要を見越したサプライチェーンの在庫充足が要因だった。夏のスポーツイベント終了後の第3四半期には稼働率が低下し、10月には中国LCDメーカー各社が国慶節休暇時期に、例年1-2日間程度の生産ライン停止を今年は1-2週間に延長した。
Q3’24には韓国と台湾で稼働率が前期比で上昇したものの、世界FPD生産ライン稼働率は中国同様、前期比でやや低下した。Q4’24の稼働率は日本を除く全地域で低下する見通しで、日本については、Sharpの問題含みの第10世代 Sakai Display Products生産ラインが第3四半期に閉鎖されQ4’24からはDSCCの生産能力予測、すなわち分母から除外されたことで、数値に歪みが生じている。
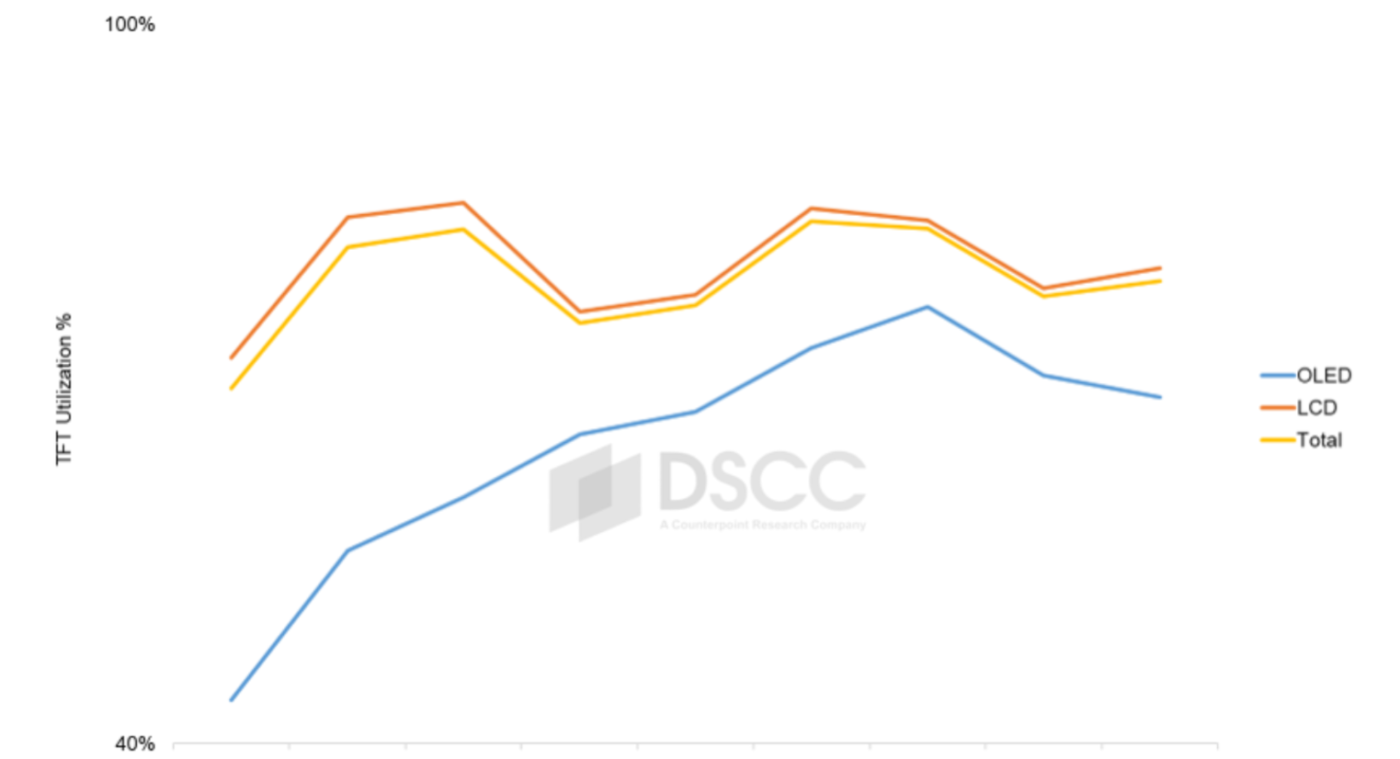
韓国はOLED生産能力シェアが著しく高く、他の地域はすべてLCDが大部分を占める。第3四半期における稼働率の鈍化は、以下の図に示す通り、LCDに限られたものであり、OLEDラインはスマートフォンの季節需要やOLED TVの需要改善により稼働率が上昇した。OLED生産能力はFPD総生産能力の10%に過ぎないため、業界全体の稼働率はLCDラインに近い。
モバイル用ディスプレイに目を向けると、ノートPC用リジッドOLED需要が引き続き増加していること、またスマートフォン用リジッドOLED需要がLTPS LCD需要を侵食し増加していることから、リジッドOLEDは2023年の低水準からQ2'24以降80%台に達するまで上昇している。リジッドOLEDとLTPS LCDはともにスマートフォン市場の下位から中位層に対応しており、プレミアムセグメントよりも季節要因の影響が少ない。ハイエンドのスマートフォンにはフレキシブルOLEDが使用されており、フレキシブルOLEDはAppleの製品導入サイクルとホリデー商戦がおもな要因として機能し、稼働率は毎年上半期に低下し下半期に上昇するという一貫した季節性パターンに落ち着いている。LGDとSDCの新たなRigid+TFE OLEDラインは、OLED搭載iPad Pro向けの供給のためQ2'24とQ3'24は稼働率が高かったが、iPad Pro需要が驚くほど低迷したためQ4'24は稼働率が急落した。
2024年上半期には緩やかに上昇したFPD生産ライン稼働率だが、下半期は減速している。業界の総生産能力はFPD需要をはるかに上回る水準にある状況が続いており、需給バランスが供給過剰に転じるのを避けるため、業界は引き続き稼働率を抑制する必要がある。Q4'24のパネル価格は安定しており、業界は「ソフトランディング」を達成したように見える。
------------------------------------
DSCCの Quarterly All Display Fab Utilization Report では、業界のすべてのFPD生産ラインを対象に生産能力、TFT投入量、稼働率を月次で追跡しており、提供データはピボットテーブルによってFPDメーカー、国、TFTライン世代、バックプレーン、フロントプレーン、基板タイプなどの項目別に分類できるようになっています。稼働率については、Q1’19以降の実績と2024年および2025年3月までの月次予測を掲載しています。
出典調査レポート Quarterly All Display Fab Utilization Report の詳細仕様・販売価格・一部実データ付き商品サンプル・WEB無料ご試読は こちらから お問い合わせください。
[原文] Flat Panel Display Fab Utilization Restrained in 2H’24
- Display fab utilization at flat panel makers peaked in Q2’24 and declined slightly in Q3’24.
- OLED fab utilization increased sequentially in Q3’24 with demand recovering in smartphones and TVs.
- Utilization for both LCD and OLED fabs is expected to decline in Q4’24 as the industry manages oversupply.
After a modest increase in the spring and summer months, flat panel display fab utilization started to decrease in the third quarter of 2024 and is decreasing further in the fourth quarter, according to the latest release of DSCC’s Quarterly All Display Fab Utilization Report, issued earlier this month. Panel makers appear to be managing utilization to avoid oversupply and inventory build-up.
We saw a modest recovery in utilization in Q2’24 based on filling the supply chain in anticipation of TV demand driven by summer sports events (Euro Cup and Paris Olympics) and IT demand from a PC refresh cycle assisted by AI PCs. After the summer sports events were finished, utilization sagged in Q3 and in October Chinese LCD makers took an extended shutdown period surrounding the National Day holiday, closing for one to two weeks instead of the typical one to two days in prior years.
Worldwide fab utilization dropped slightly Q/Q in Q3’24 despite sequential increases in utilization in Korea and Taiwan, as utilization in China. We expect Q4’24 utilization to be lower in all regions except Japan, where the regional figure is distorted by the closure of Sharp’s troubled Gen 10 Sakai Display Products fab, which shut down in Q3 and is removed from our capacity estimates (the denominator) starting in Q4’24.
Korea has a dramatically higher share of its capacity as OLED, while all other regions are dominated by LCD. The slowdown in utilization in Q3 was largely confined to LCD as shown on the next chart, as OLED line utilization increased with seasonal demand for smartphones and improvement in OLED TV demand. The industry’s total utilization closely follows the LCD line as OLED capacity represents only 10% of total FPD capacity.
Turning to mobile displays, rigid OLED increased from low levels in 2023 to reach the 80% range since Q2’24 as demand for rigid OLED panels for notebook PCs continues to increase and demand for rigid OLED smartphone panels has increased at the expense of LTPS LCD. Both rigid OLED and LTPS LCD serve the lower and mid tiers of the smartphone market which exhibit less seasonality than the premium segment. Higher-end smartphones use flexible OLED panels, and flexible OLED has settled into a consistent seasonal pattern of lower UT% in the first half and higher UT% in the second half of each year, driven primarily by Apple’s product introduction cycle and holiday sales. The new Rigid+TFE OLED lines for LGD and SDC were running at high utilization in Q2’24 and Q3’24 to supply OLED panels for the OLED iPad Pro, but utilization has plummeted in Q4’24 as iPad Pro demand has been surprisingly weak.
After a modest increase in the first half of 2024, display fab utilization is slowing down in the second half. Total industry capacity continues to far outstrip demand for displays, and the industry will need to continue to restrain utilization to avoid shifting the supply/demand balance into oversupply. Panel prices have stabilized in Q4’24, so the industry appears to have achieved a “soft landing”.
DSCC’s Quarterly All Display Fab Utilization Report covers capacity, TFT Input and utilization by month for every flat panel display fab in the industry, with pivot tables to allow segmentation by supplier, country, TFT fab generation, backplane, frontplane or substrate type. The report provides historical utilization back to Q1’19 and a forecast by month for 2024 and the first three months of 2025.


