TV用LCD価格月報~下落が継続

出典調査レポート Quarterly All Display Fab Utilization Report の詳細仕様・販売価格・一部実データ付き商品サンプル・WEB無料ご試読は こちらから お問い合わせください。
これらDSCC Japan発の分析記事をいち早く無料配信するメールマガジンにぜひご登録ください。ご登録者様ならではの優先特典もご用意しています。【簡単ご登録は こちらから 】
冒頭部和訳
今春、TV用LCD価格は2月から6月にかけて上昇したが、第3四半期には下落に転じ、夏場の低迷に突入した。第2四半期は価格上昇でTVパネルメーカーの収益性が改善したが、第3四半期は収益性悪化の可能性が高い。過去に多く見られた展開とは異なり、LCD価格の急激な悪化はなく、少なくとも今後数ヵ月は緩やかな下落になるものと見られる。この2024年下半期の低迷は、2023年下半期に見られた短期間の低迷と2024年上半期の短期間の上昇に続くものであり、今回の「ミニサイクル」はLCD価格が狭いレンジ内で維持されている異例の安定期を意味する。
Q2'24に入って稼働率は上昇し、軟調な需要と相まって価格上昇に終止符が打たれた。DSCCの Quarterly All Display Fab Utilization Report によると、LCDメーカーの稼働率はQ1'24の77%からQ2'24には86%に上昇した。LCD TFT総投入量はQ4’23とQ1’24の低迷後、Q2'24は前期比12%増となった。Q3'24の稼働率は83%に減速、投入面積は前期比4%減になると予測されている。
LCD TV Panel Prices Continuing to Decline
The springtime rally in LCD TV panel prices from February to June has turned into a summertime slump as panel prices are headed down in the third quarter. The rally helped TV panel makers to improve profitability in the second quarter, but that profitability is likely to deteriorate in the third quarter. Unlike many former transitions, we do not expect a rapid deterioration in panel prices but rather a soft decline, at least for the next few months. This slump in 2H’24 follows a short rally in 1H’24, which followed a short slump in 2H’23, and together these “mini-cycles” represent a period of unusual stability in panel prices, where they have been sustained within a narrow range.
Higher utilizations in Q2’24 have combined with soft demand to bring the rally to an end. Based on DSCC’s Quarterly All Display Fab Utilization Report, LCD makers increased their utilization from 77% in Q1’24 to 86% in Q2’24. After a slow Q4’23 and Q1’24, total LCD TFT increased by 12% Q/Q in Q2’24. We expect utilization to slow down to 83% in Q3’24 and area input to decline by 4% Q/Q.
On the demand side, TV demand has remained tepid, with overall TV shipments declining 4% Y/Y in Q1’24, according to the Counterpoint Research Global TV Tracker. Furthermore, the boost in demand for TV panels in anticipation of European sporting events has played out – those shipments have arrived in Europe, and European demand will soften after the Olympics are finished. Reports from the “618” shopping festival in China suggested that demand there remains tepid at best, and Amazon’s Prime Day promotion had little excitement in the TV category.
The first chart here highlights our latest TV panel price update with a forecast to October 2024, starting with the first post-pandemic rally which started after prices hit their all-time lows in September 2022. Prices increased modestly in Q4’22 and Q1’23 before larger price increases covered Q2’23 and Q3’23, followed by a mild slump in Q4’23 and a mild rally in Q1-Q2’24. Prices for July came in close to our expectations, and our forecast for August prices are mostly unchanged from last month.
LCD TV Panel Prices
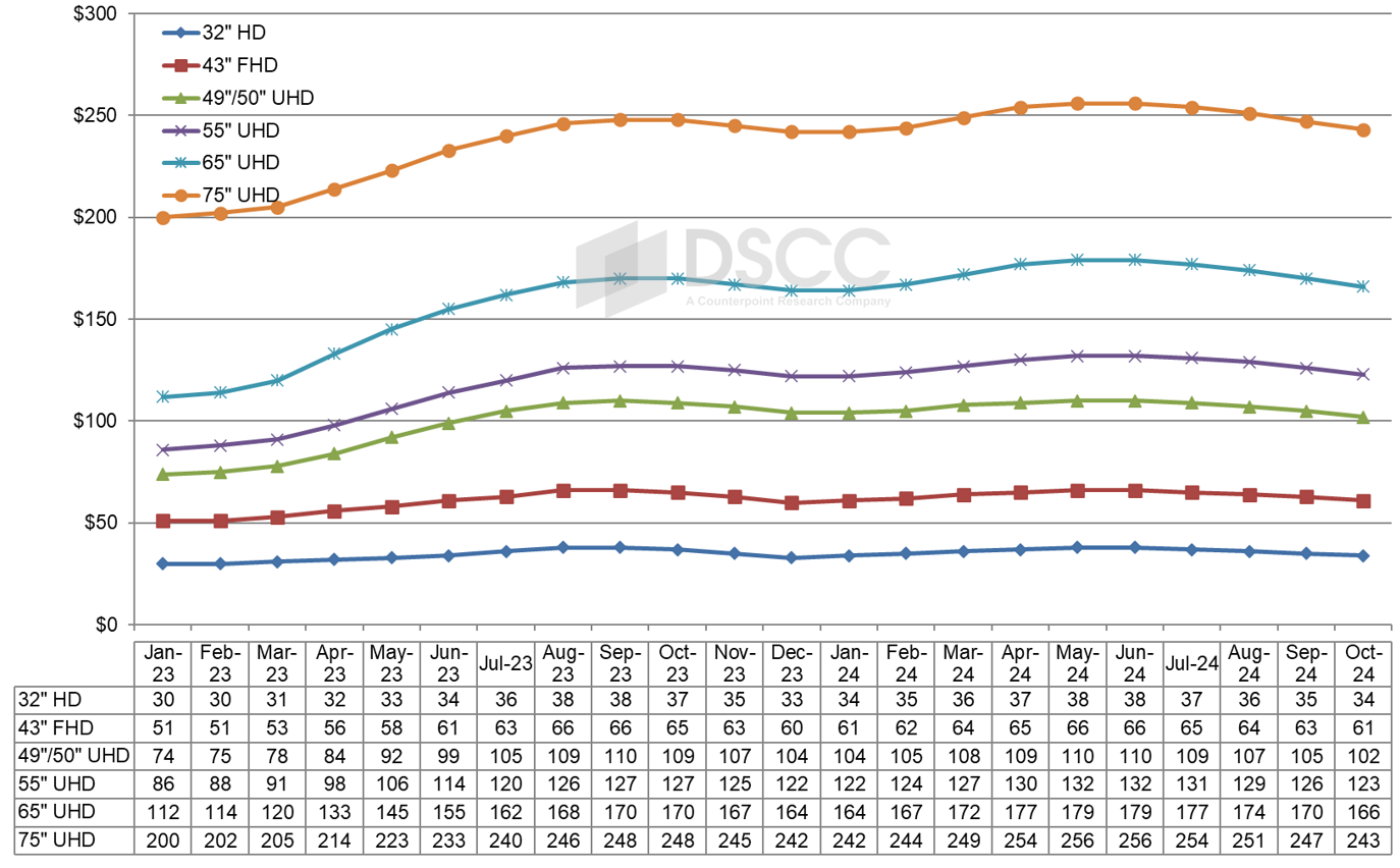
Prices in Q1’24 were nearly flat on average Q/Q, with some sizes showing small Q/Q declines and a few showing small Q/Q increases, but Q2 saw a robust average price increase of 5.5% Q/Q. With prices coming down starting in July, we are seeing an average price decrease in Q3 of 2.6%, but the average Q3 prices will remain higher than the Q1 average.
As we look at pricing on an area basis, we are seeing a pattern characteristic of oversupply. The smallest TV panel size in our index, 32”, is the ‘canary in the coal mine’ of pricing in the industry. The prices for 32” panels are the first to go up with a supply constraint and are the first to go down in an oversupply. We have seen that pattern bear out in the Q1-Q2’24 rally, and we are seeing it in the Q3’24 slump.
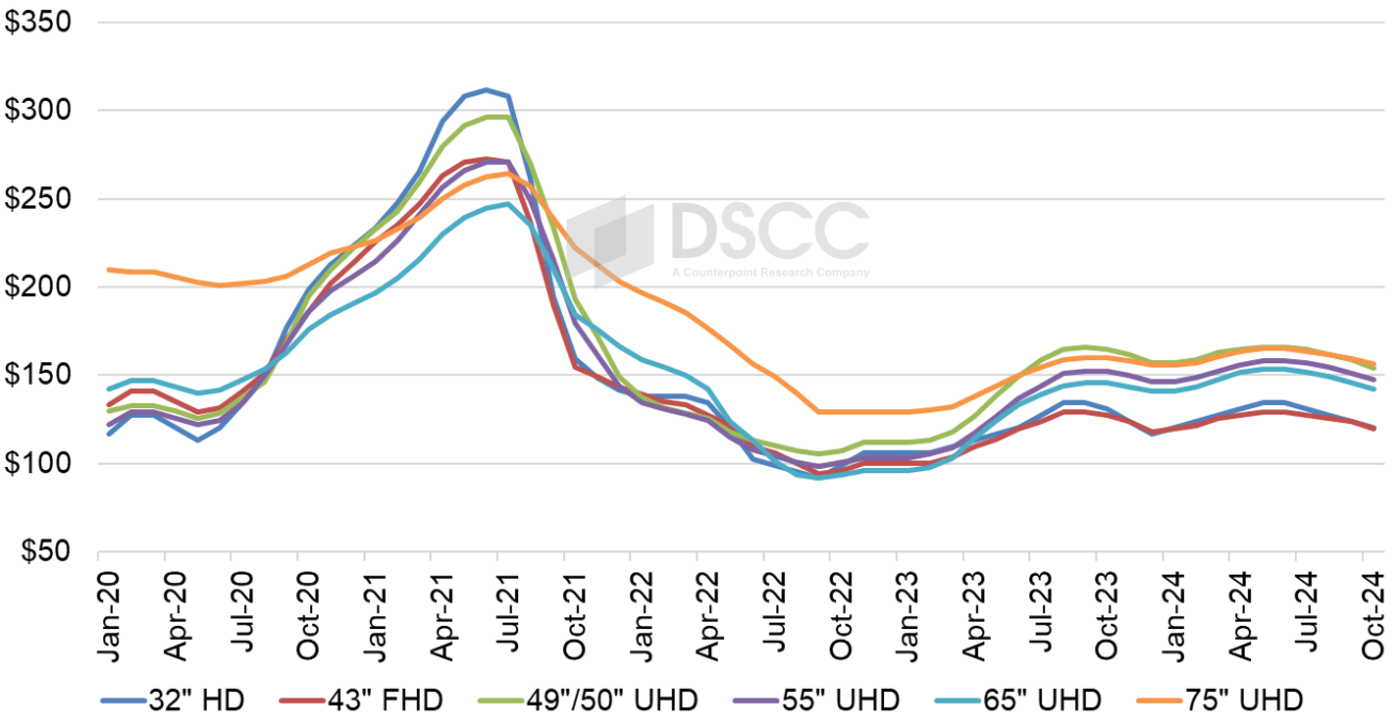
At the prior low point in December 2023, 32” and 43” panels had the lowest area price at $117 and $118 per square meter, respectively, but area prices were higher for 65” ($141), 55” ($146), 75” ($156) and 49/50” ($157). The area price premium for 65” panels over 32” panels was 21% in December, but it was reduced to 14% in June. Now as the market has shifted to oversupply, we are seeing that premium increase, and expect it to reach 18% in September.
The area prices for 49”/50” were especially strong in this up-cycle, while area prices for 43” panels have been the lowest in the industry. The premium for 49”/50” over 43” started the year at 31% in January and declined slightly but has stabilized at 28-29% since April, a pattern which we expect will continue through October. A premium for 49”/50” over 43” favors panel makers with Gen 8.5 capacity at the expense of those with Gen 10.5 capacity. Gen 10.5 fabs can make 43” very efficiently with an 18-up configuration, but do not have an efficient cut for 49”/50”, while Gen 8.5 fabs can make 49”/50” panels efficiently with an 8-up configuration.
Monthly Area Prices per Square Meter for LCD TV Panels
Our final chart in this sequence shows our LCD TV panel price index, taking a longer view from 2015 through October 2024. The price increases in 2023 brought our index up to a peak of 44.8 in September 2023, an increase of 47% compared to the low of 30.5 in September 2022. The index declined to 41.8 in December, which was down 7% from the recent peak but still up 29% Y/Y and up 37% compared to the all-time low. Prices peaked again in May/June 2024 at 45.6, slightly higher than last year’s peak and 49% higher than the all-time low of September 2022. We now expect prices to fall to 42.2 in October 2024.
LCD TV Panel Price Index
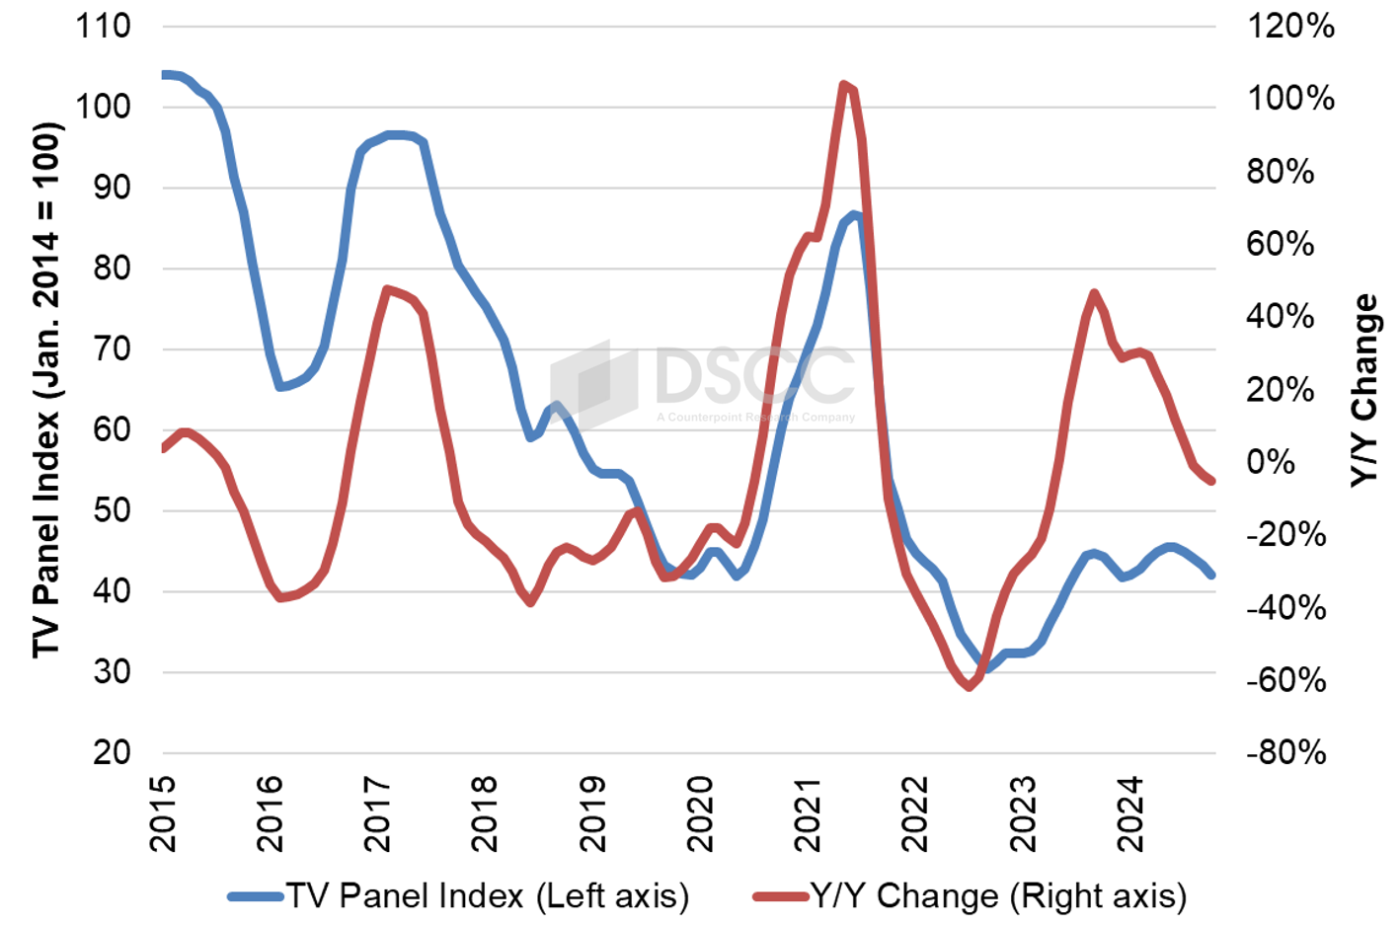
The chart reveals another intriguing characteristic of the recent pattern in panel prices. As of July 2024, prices have remained for thirteen months within a relatively tight range from 41.8 to 45.6, less than 10%. This represents a period of stability in LCD TV panel prices not seen since at least 2015, and we expect that prices will remain within this range at least through October.
The higher LCD TV panel prices helped panel makers to improve profitability in the second quarter of 2024, as AUO reported breaking even for the quarter last week . We expect Innolux to report something similar and expect BOE and China Star to report profits.
The industry’s restraint in Q4’23-Q1’24 allowed for a modest price rise, but the industry’s capacity still far outstrips the likely demand for the foreseeable future, and high utilizations will put downward pressure on prices. Panel makers will need to recover their disciplined ways to minimize the down cycle in the second half of the year.
出典調査レポート Quarterly All Display Fab Utilization Report の詳細仕様・販売価格・一部実データ付き商品サンプル・WEB無料ご試読は こちらから お問い合わせください。