TV用LCD価格月報~価格下落は第4四半期も継続
出典調査レポート Quarterly All Display Fab Utilization Report の詳細仕様・販売価格・一部実データ付き商品サンプル・WEB無料ご試読は こちらから お問い合わせください。
これらDSCC Japan発の分析記事をいち早く無料配信するメールマガジンにぜひご登録ください。ご登録者様ならではの優先特典もご用意しています。【簡単ご登録は こちらから 】
冒頭部和訳
夏から秋へと季節が移り変わるにしたがい、TV用LCD価格が下落している。春の価格上昇によってTVパネルメーカー各社は第2四半期に収益性を改善することができたが、第3四半期は収益性が悪化の見通しだ。過去に見られた下落サイクルの多くに比べると価格下落ペースは緩やかで、このパターンは今後数ヶ月間の継続が見込まれるが、現時点ではまだ価格の底打ちは見られない。
Q2’24の稼働率上昇と需要低迷により、春の価格上昇に終止符が打たれた。 DSCCの Quarterly All Display Fab Utilization Report によると、LCDメーカーの稼働率はQ1’24の77%からQ2'24には86%に上昇した。LCD TFT総投入量はQ4'23からQ1'24の減速を経てQ2'24には前期比12%増となった。
稼働率は第3四半期に83%まで減速すると見られるが、それ以上になる可能性を示す兆候もある。中国FPDメーカー各社は国慶節休暇に合わせ10月初旬の生産ライン停止を計画しているが、その内容は業界の供給コントロールに向けた異例の措置となっている。例年、国慶節休暇の停止は1-2日間だけだが、今年は1-2週間になることを各社が示唆している。第4四半期初めに操業停止が予定されていることから、FPDメーカー各社は第3四半期の稼働率を当初見通しよりも高い水準に維持している。
需要面に目を向けると、TV需要は依然低調で、Q2’24のTV出荷総数は前年比3%増だったことを Counterpoint Research Quarterly Global TV Shipments Tracker が明らかにしている。欧州のスポーツイベントを見越したTVパネル需要の盛り上がりが前年比成長の要因となったが、2024年下半期には大きな需要促進要因が見当たらないため、大幅成長は見込めない。
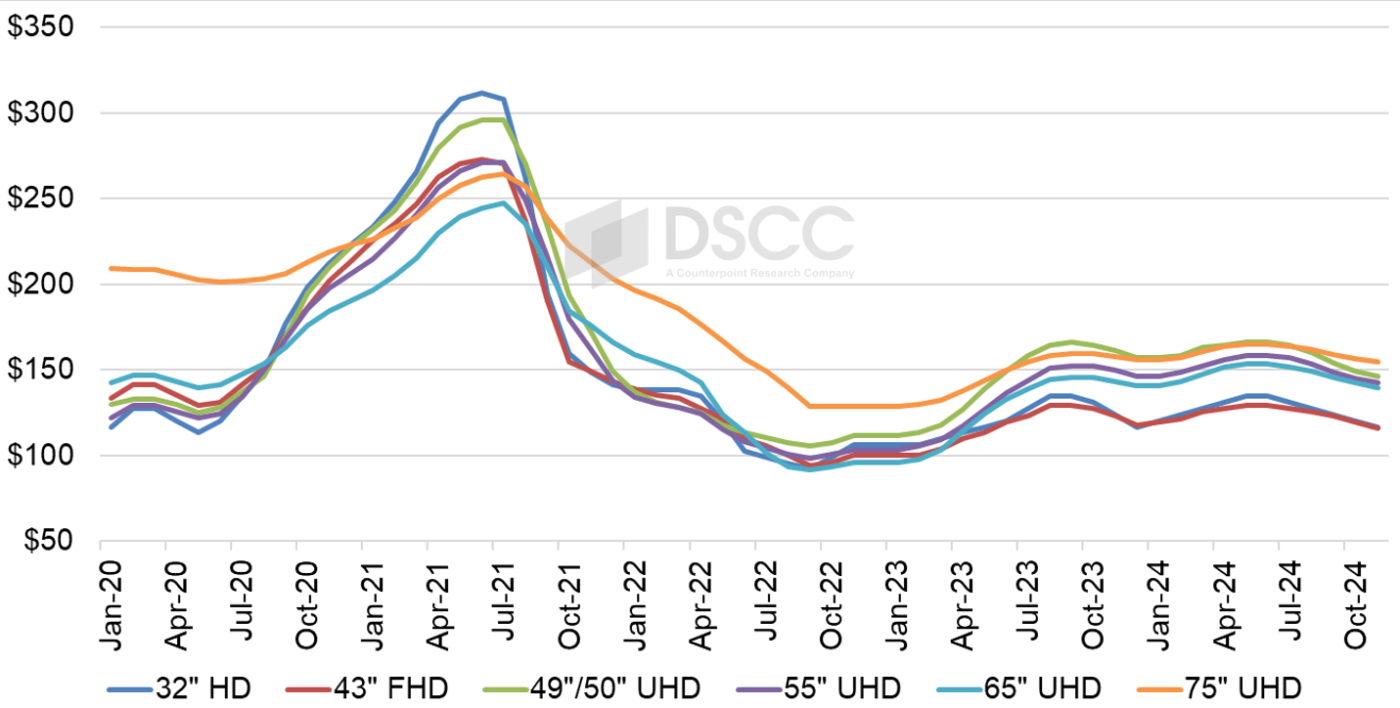
一つ目のグラフは2024年11月までのTV用LCD価格動向の最新予測である。価格は2022年9月に過去最低値を記録した後、パンデミック後の最初の反発局面が始まった。価格はQ4’22からQ1’23にかけて緩やかに上昇した後、Q2’23とQ3’23に大幅な上昇を示した。続くQ4’23にはやや低迷、Q1’24からQ2’24にかけてやや上昇が見られた。8月の価格は当初予測と同等またはわずかに低い水準となったが、9月の価格予測は先月とほぼ同様である。
LCD TV Panel Prices Declining into Q4
As summer turns to fall, falling is exactly what is happening to LCD TV panel prices. The springtime rally helped TV panel makers to improve profitability in the second quarter, but that profitability is likely to deteriorate in the third quarter. Compared to many former down-cycles, the pace of price declines is more gradual, and we expect that pattern to continue in the coming months, but as of now we do not yet see prices bottoming out.
Higher utilizations in Q2’24 combined with soft demand to bring the springtime rally to an end. Based on DSCC’s Quarterly All Display Fab Utilization Report, LCD makers increased their utilization from 77% in Q1’24 to 86% in Q2’24. After a slow Q4’23 and Q1’24, total LCD TFT increased by 12% Q/Q in Q2’24.
We expected utilization to slow down to 83% in Q3’24 but there are indications that it may come in higher. Chinese panel makers have planned to shut down their fabs in early October for the National Day holiday, an unusual step to control industry supply. Normally, the National Day shutdown may be only one to two days, but this year panel makers indicate it will be one to two weeks. With the shutdown planned at the start of Q4, panel makers are keeping utilization higher than expected in the third quarter.
On the demand side, TV demand has remained tepid, with overall TV shipments increasing 3% Y/Y in Q2’24, according to the Counterpoint Research Quarterly Global TV Shipments Tracker. The boost in demand for TV panels in anticipation of European sporting events spurred the Y/Y increase, but with no strong demand drivers in the second half of 2024 we do not see significant increases likely.
The first chart here highlights our latest TV panel price update with a forecast to November 2024, starting with the first post-pandemic rally which started after prices hit their all-time lows in September 2022. Prices increased modestly in Q4’22 and Q1’23 before larger price increases covered Q2’23 and Q3’23, followed by a mild slump in Q4’23 and a mild rally in Q1-Q2’24. Prices for August came in equal to or slightly lower than our expectations, and our forecast for September prices is mostly unchanged from last month.
LCD TV Panel Prices
Prices in Q2’24 saw a robust average price increase of 5.5% Q/Q. With prices coming down starting in July, we are seeing an average price decrease in Q3 of 3.0% (last month we estimated this at 2.6%), but the average Q3 prices will remain higher than the Q1 average.
As we look at pricing on an area basis, we are seeing a pattern characteristic of oversupply. The smallest TV panel size in our index, 32”, is the ‘canary in the coal mine’ of pricing in the industry. The prices for 32” panels are the first to go up with a supply constraint and are the first to go down in an oversupply. We have seen that pattern bear out in the rally in the first half of 2024 and we are seeing it in the Q3’24 slump.
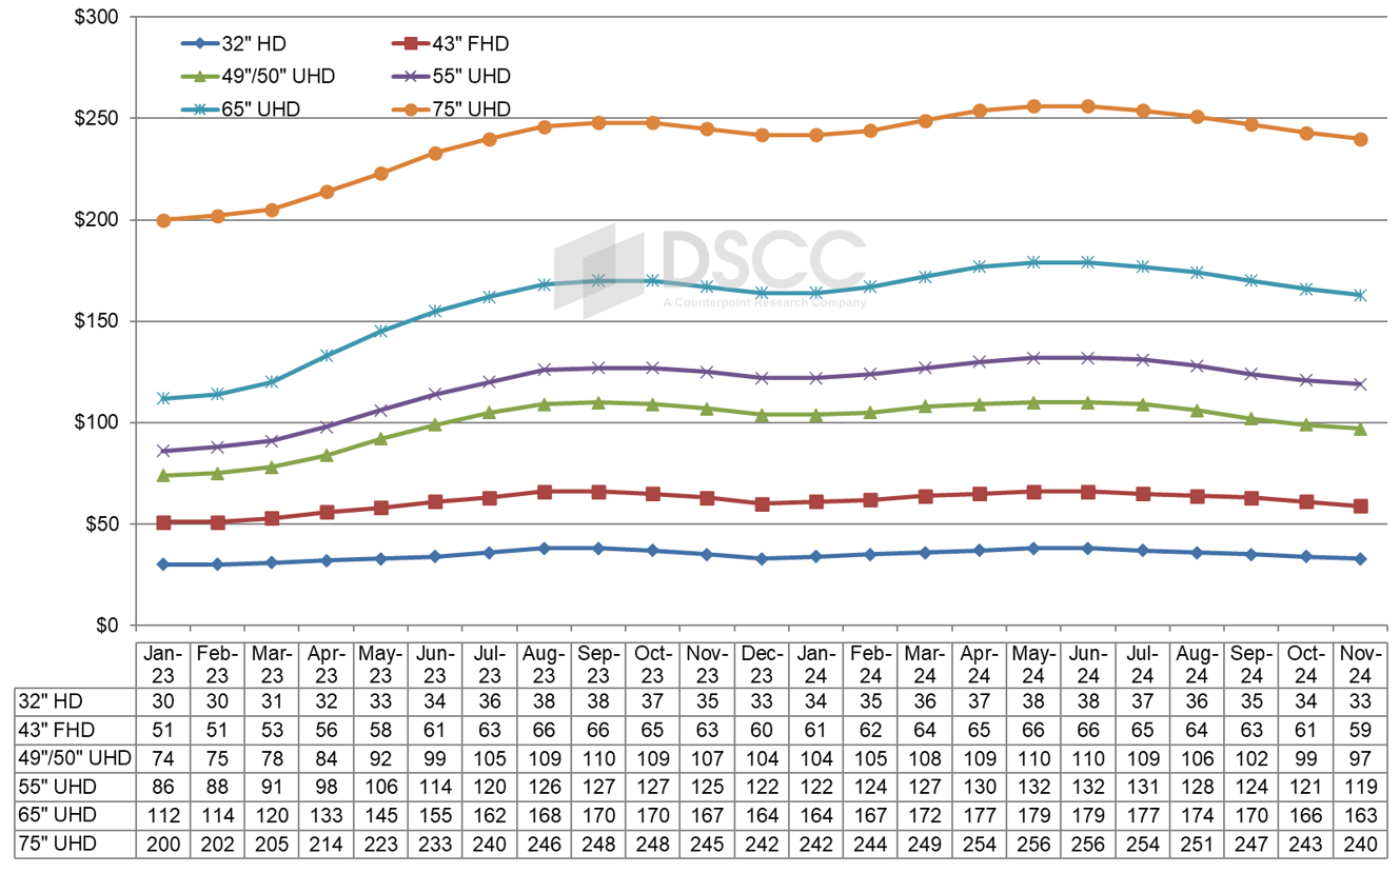
At the prior low point in December 2023, 32” and 43” panels had the lowest area price at $117 and $118 per square meter, respectively, but area prices were higher for 65” ($141), 55” ($146), 75” ($156) and 49/50” ($157). The area price premium for 65” panels over 32” panels was 21% in December, but it was reduced to 14% in June. Now as the market has shifted to oversupply, we are seeing that premium increase and expect it to reach 20% by November.
The area prices for 49”/50” were especially strong in this up-cycle, while area prices for 43” panels have been the lowest in the industry. The premium for 49”/50” over 43” started the year at 31% in January and declined slightly but stabilized at 28-29% from April through August. We expect that 49”/50” prices will decline faster than 43” prices in September and the premium to drop to 25% but expect it to return to 30% by November. A premium for 49”/50” over 43” favors panel makers with Gen 8.5 capacity at the expense of those with Gen 10.5 capacity. Gen 10.5 fabs can make 43” very efficiently with an 18-up configuration, but do not have an efficient cut for 49”/50”, while Gen 8.5 fabs can make 49”/50” panels efficiently with an 8-up configuration.
Monthly Area Prices per Square Meter for LCD TV Panels
Our final chart in this sequence shows our LCD TV panel price index, taking a longer view from 2015 through October 2024. The price increases in 2023 brought our index up to a peak of 44.8 in September 2023, an increase of 47% compared to the low of 30.5 in September 2022. The index declined to 41.8 in December 2023, which was down 7% from the recent peak but still up 29% Y/Y and up 37% compared to the all-time low. Prices peaked again in May/June 2024 at 45.6, slightly higher than last year’s peak and 49% higher than the all-time low of September 2022. We now expect prices to fall to 40.9 in November 2024, slightly lower than the low point a year ago.
LCD TV Panel Price Index (January 2015 – November 2024)
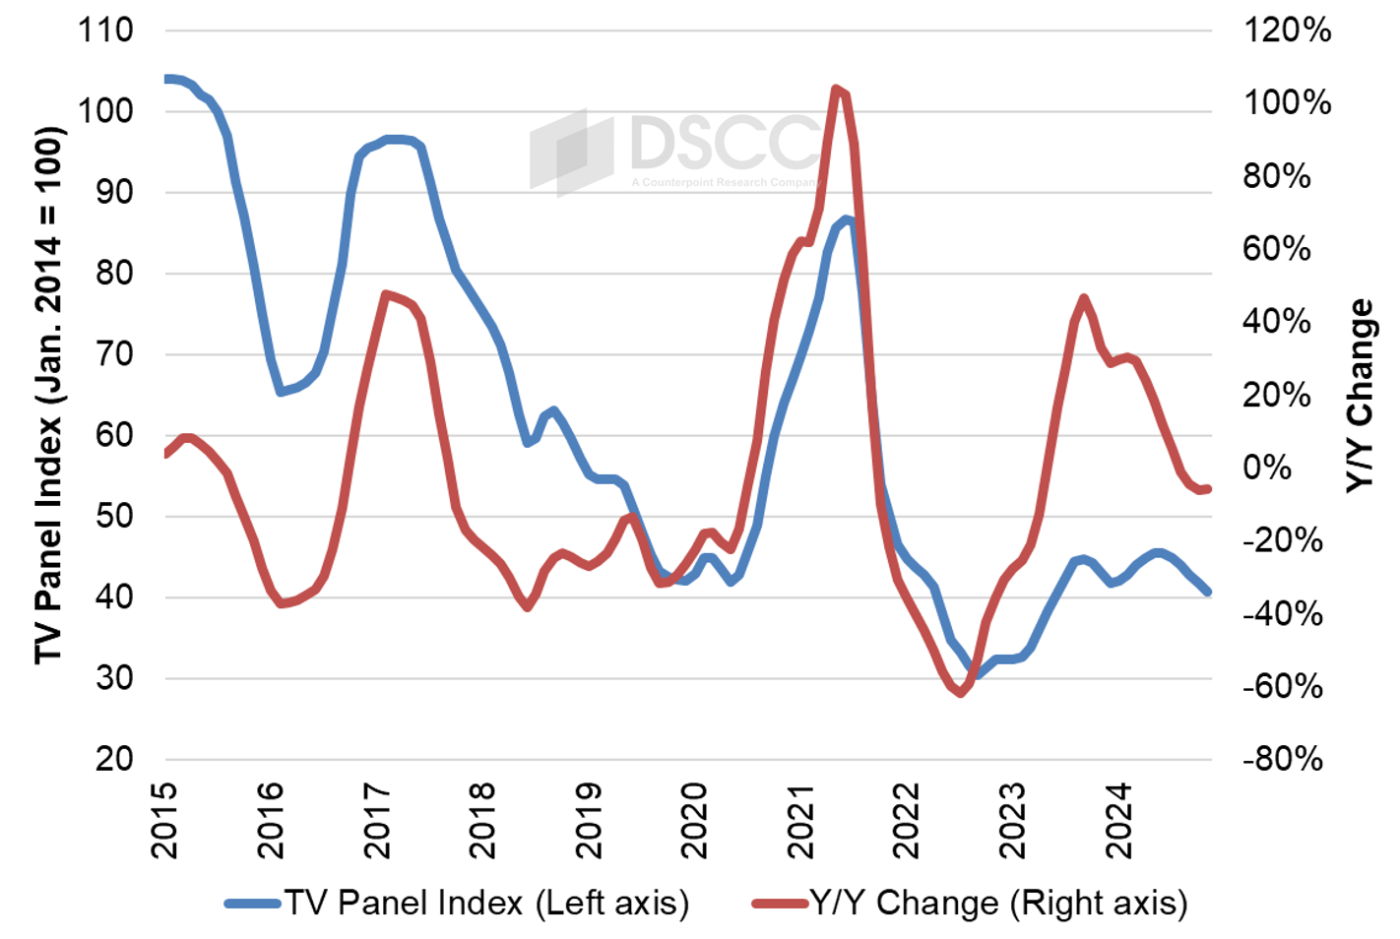
The chart reveals another intriguing characteristic of the recent pattern in panel prices. As of August 2024, prices have remained for fourteen months within a relatively tight range from 41.8 to 45.6, less than 10%. This represents a period of stability in LCD TV panel prices not seen since at least 2015, and we expect that prices will remain within this range at least through October, and even the November price of 40.9 remains within a 10% range of the recent peak.
The higher LCD TV panel prices helped panel makers to improved profitability in the second quarter of 2024, as the three Chinese panel makers focused on large-screen LCDs – BOE, CSOT and CHOT – all reported profits in Q2 as we reported last week.
The higher-than-expected utilizations in the third quarter have put some downward pressure on LCD TV panel prices, but the Chinese panel makers have signaled with their planned shutdown that they intend to keep supply under control. We will see if that shutdown is enough to stabilize or increase prices.
出典調査レポート Quarterly All Display Fab Utilization Report の詳細仕様・販売価格・一部実データ付き商品サンプル・WEB無料ご試読は こちらから お問い合わせください。