TV用LCD価格月報~第4四半期は横ばい続く
これらDSCC Japan発の分析記事をいち早く無料配信するメールマガジンにぜひご登録ください。ご登録者様ならではの優先特典もご用意しています。【簡単ご登録は こちらから 】
TV用LCD価格月報~第4四半期は横ばい続く
中国の主要LCDメーカー各社による生産抑制で第4四半期の業界供給量が抑えられた結果、TV用LCD価格が安定した。DSCCでは、少なくとも4ヵ月連続ですべてのパネルサイズの価格が横ばいになると予測しているが、これは史上初めてのことだ。
中国FPDメーカー各社は国慶節休暇に合わせて10月初旬に生産ラインを停止したが、これは業界の供給コントロールを目的とした異例の措置だ。例年、国慶節休暇の停止は1-2日間程度だが、今年は1-2週間に及んだ。この10月の操業停止により、Q4’24のLCD TFT生産ライン稼働率は77%となり、TFT投入量は前期比7%減になると予測される。
需要面に目を向けると、TV需要は堅調に推移しており、Q3’24のTV出荷総数は前年比11%増だったことをCounterpoint Researchの Quarterly Global TV Shipments Tracker が明らかにしている。TV出荷数の成長は地域的に広範囲にわたっており、北米や西欧を含む先進地域で特に力強い伸びが見られた。
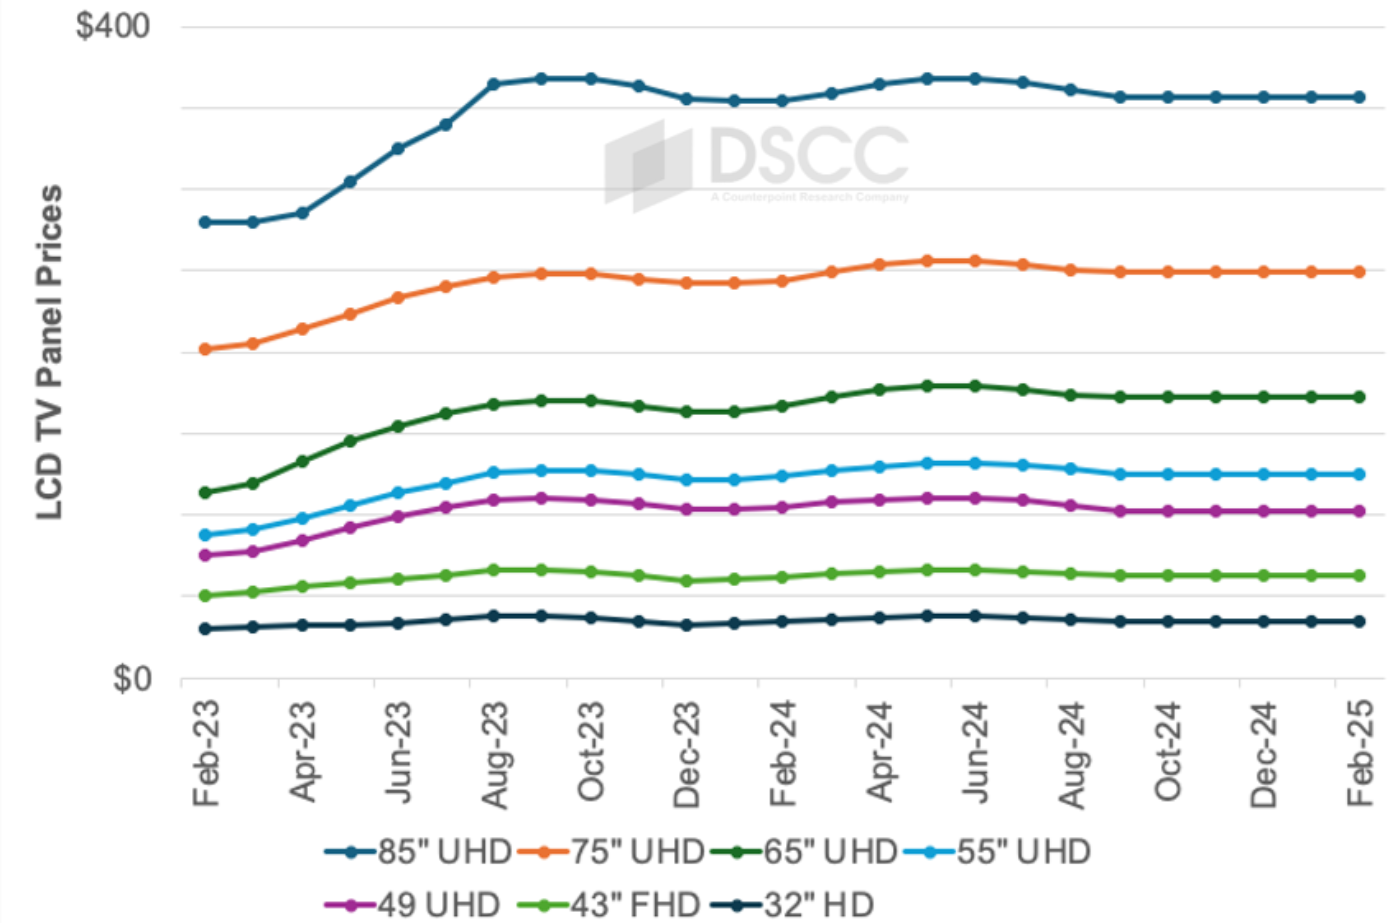
一つ目のグラフは2025年2月までのTV用LCD価格動向の最新予測で、価格が2022年9月に過去最低値を記録した後、上昇を始めたことが見てとれる。価格はQ2’23とQ3’23に上昇した後、Q4’23にはやや低迷、Q1’24からQ2’24にかけて緩やかに上昇した。11月の価格は当社予測通り10月から横ばいだった。この結果を受け、価格は少なくとも2月までこの安定状態が続くと予測される。
価格はQ2’24に前期比で平均5.5%高と大きく上昇、Q3’24は平均2.8%の下落となった。第4四半期の平均価格は安定が予測されるが、9月の価格が第3四半期の平均価格を下回ったため、第4四半期の平均価格は第3四半期に比べ2.1%下落すると見られる。
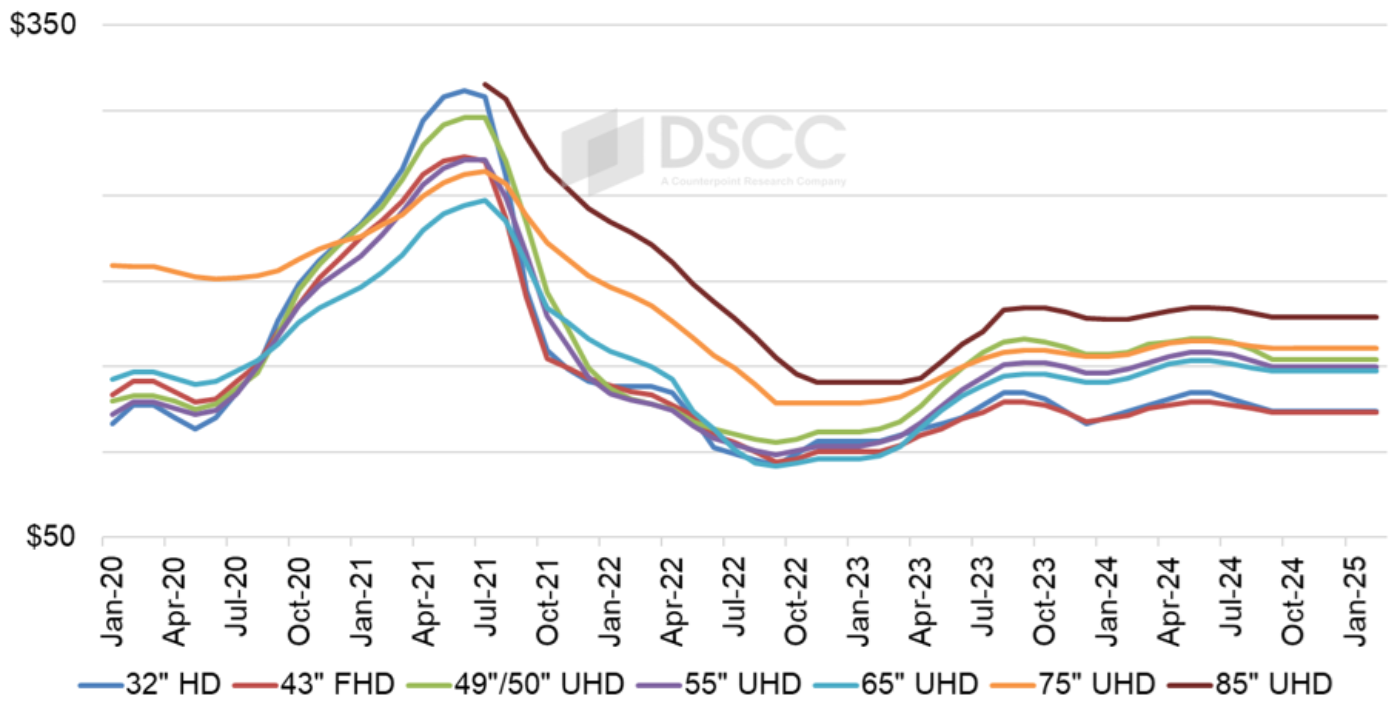
面積ベースの価格を見ると、供給過剰の典型的なパターンが見られる。当社の指数で最も小さいTV用パネルサイズである32インチは、業界の価格設定における「炭鉱のカナリア」だ。32インチパネルの価格は、供給制約のときに最初に上昇し、供給過剰のときには最初に下落する。このパターンは2024年上半期の上昇局面で実証され、2024年下半期の下落局面でも示されている。
前回最安値を示した2023年12月のパネル面積価格 (1平方メートルあたり) は、32インチが117ドル、43インチが118ドルでそれぞれ最低水準だったが、65インチ (141ドル) 、55インチ (146ドル) 、75インチ (156ドル) 、49インチ/50インチ (157ドル) のパネル面積価格はそれよりも高かった。32インチに対する65インチのパネル面積価格プレミアムは12月には21%だったが、6月には14%に下がった。市場が供給過剰に転じるとプレミアムは上昇し、現在は19%で安定している。
49インチ/50インチは今年中盤の上昇サイクルで特に価格が上昇したが、43インチパネルの面積価格は業界最低水準だった。43インチに対する49インチ/50インチのプレミアムは1月の31%からやや下がったが4月から8月までは28%-29%で安定し9月には25%まで低下、今後は25%で安定すると見られる。43インチに対する49インチ/50インチの価格プレミアムは第8.5世代の生産能力を持つLCDメーカーに有利に働き、その代償を負うのは第10.5世代のLCDメーカーだ。第10.5世代生産ラインでは43インチを18面取りで非常に効率的に生産できるが、49インチ/50インチの面取り効率は良くない。一方、第8.5世代生産ラインでは49インチ/50インチパネルを8面取りで効率的に生産できる。
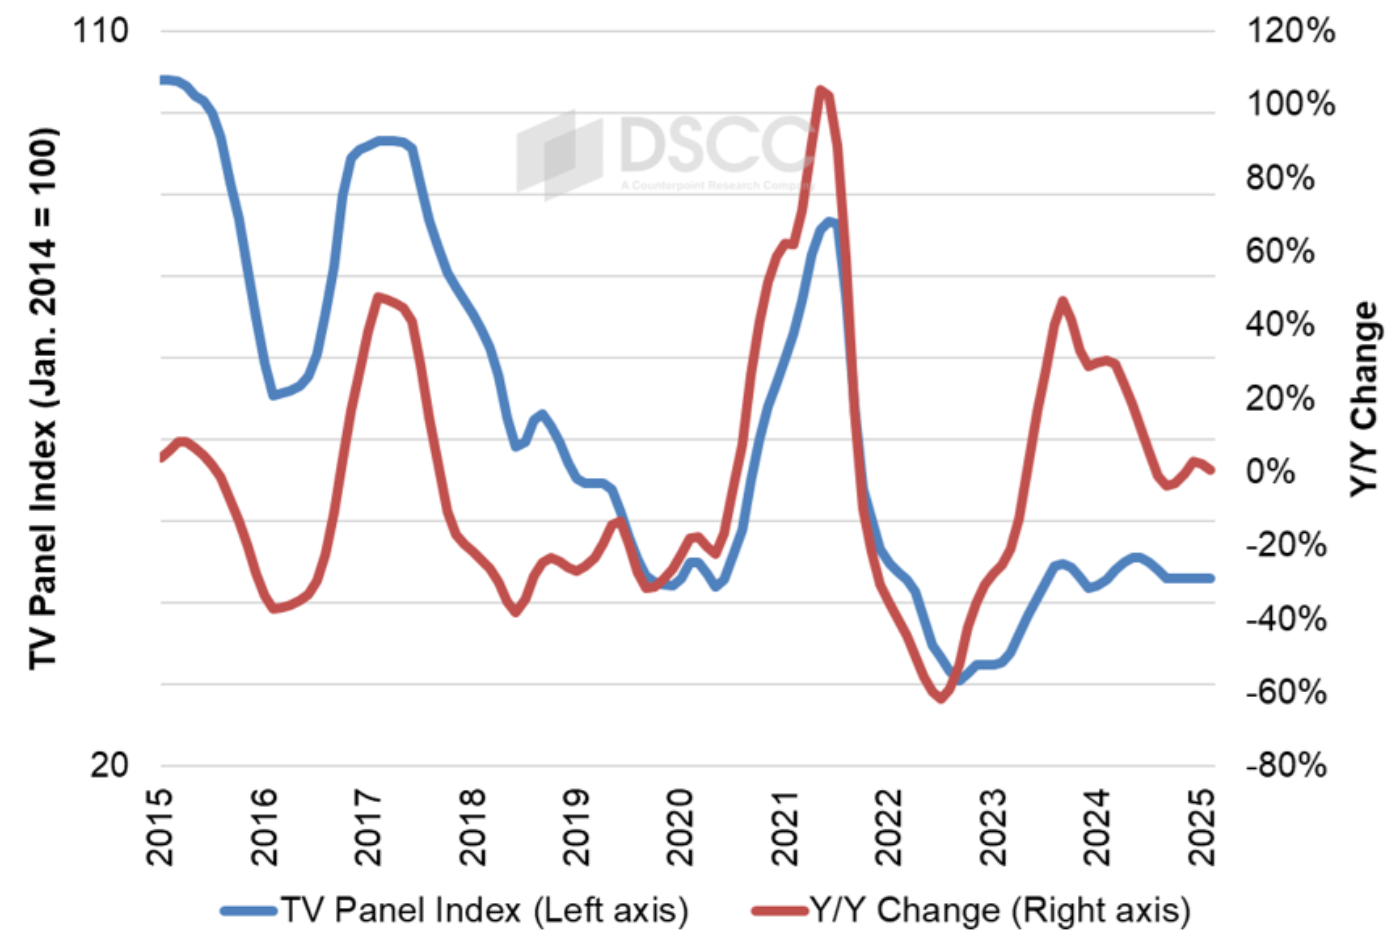
最後のグラフは2015年から2025年1月までの長期的視点によるTV用LCD価格指数を示している。2023年の価格上昇によってDSCCの指数は2023年9月に44.8に到達、2022年9月の30.5という最低値と比べ47%上昇した。2023年12月には指数が41.8まで下落、直近のピークから7%下がったものの、前年比では29%上昇、過去最低値と比較すると37%上昇となった。2024年5月-6月には再びピークの45.6に達した。これは昨年のピークをわずかに上回っており、2022年9月の過去最低値と比べ49%上昇となった。9月の価格指数は43.1で安定、過去最低値を41%上回った。2024年11月の価格は1年前と同水準で、12月の価格は1年前と比べ3%高くなると予測される。
このグラフにはパネル価格の最近のパターンにおけるもう一つの興味深い特徴が示されている。2024年11月時点で価格指数は16ヵ月間、41.8から45.6の比較的狭い範囲内、10%未満の範囲に留まっており、2ヵ月間は全く変化がない。これはTV用LCD価格がかつてないほど安定していることを表しており、少なくとも2月まではこの範囲内に留まると予測される。
第3四半期のTV用LCD価格の下落によってLCDメーカー各社の収益性はQ3’24に低下し、大半のメーカーは営業利益が減少 (または営業損失が増加) した。Samsung Displayを除くと、業界全体の営業利益率はQ3'24でわずか1%でかろうじて損益分岐点を上回り、BOEを除くと業界全体の営業利益率はマイナスとなる。つまり、TV用LCD価格の安定的な推移は価格下落よりもはるかに良いが、現在の価格水準ではFPDメーカーは赤字が続くことになる。
[原文] LCD TV Panel Prices Have Flatlined in Q4
Restrained production by major Chinese LCD makers has kept a lid on industry supply in the fourth quarter, and as a result LCD TV panel prices have stabilized. For the first time ever, in our outlook we expect prices for all panel sizes to be unchanged for at least four consecutive months.
Chinese panel makers shut down their fabs in early October for the National Day holiday, an unusual step to control industry supply. Normally, the National Day shutdown may be only one to two days, but this year panel makers shut down for one to two weeks. With these October shutdowns, we now expect that Q4 utilization of LCD TFT fabs will come in at 77% in Q4’24, and TFT input is expected to decrease by 7% Q/Q.
On the demand side, TV demand firmed up, with overall TV shipments increasing 11% Y/Y in Q3’24, according to the Counterpoint Research Quarterly Global TV Shipments Tracker. TV shipment growth was broad-based across geographic regions, with strong growth in advanced regions including North America and Western Europe.
The first chart here highlights our latest TV panel price update with a forecast to February 2025, starting with the rally which started after prices hit their all-time lows in September 2022. Prices increased in the middle two quarters of 2023, followed by a mild slump in Q4’23 and a mild rally in Q1’24-Q2’24. Prices for November came in right in line with our expectation that they would be unchanged from October. As a result, we now forecast that this stability will continue at least through February.
Prices in Q2’24 saw a robust average price increase of 5.5% Q/Q, and in Q3’24 we saw an average price decrease of 2.8%. Although we expect prices to be stable in the fourth quarter, September’s prices were lower than the Q3 average, so we expect that the average price in Q4 will be down 2.1% compared to Q3.
As we look at pricing on an area basis, we see a pattern characteristic of oversupply. The smallest TV panel size in our index, 32”, is the ‘canary in the coal mine’ of pricing in the industry. The prices for 32” panels are the first to go up with a supply constraint and are the first to go down in an oversupply. We have seen that pattern bear out in the rally in the first half of 2024 and we are seeing it in the slump in the second half of 2024.
At the prior low point in December 2023, 32” and 43” panels had the lowest area price at $117 and $118 per square meter, respectively, but area prices were higher for 65” ($141), 55” ($146), 75” ($156) and 49/50” ($157). The area price premium for 65” panels over 32” panels was 21% in December, but it was reduced to 14% in June. When the market shifted to oversupply, we saw that premium increase and we now see it stabilizing at 19%.
The area prices for 49”/50” were especially strong in the mid-year up-cycle, while area prices for 43” panels were the lowest in the industry. The premium for 49”/50” over 43” started the year at 31% in January and declined slightly but stabilized at 28%-29% from April through August before declining to 25% in September. We expect the price premium to stabilize at 25%. A premium for 49”/50” over 43” favors panel makers with Gen 8.5 capacity at the expense of those with Gen 10.5 capacity. Gen 10.5 fabs can make 43” very efficiently with an 18-up configuration, but do not have an efficient cut for 49”/50”, while Gen 8.5 fabs can make 49”/50” panels efficiently with an 8-up configuration.
Our final chart in this sequence shows our LCD TV panel price index, taking a longer view from 2015 through January 2025. The price increases in 2023 brought our index up to a peak of 44.8 in September 2023, an increase of 47% compared to the low of 30.5 in September 2022. The index declined to 41.8 in December 2023, which was down 7% from the recent peak but still up 29% Y/Y and up 37% compared to the all-time low. Prices peaked again in May/June 2024 at 45.6, slightly higher than last year’s peak and 49% higher than the all-time low of September 2022. The price index stabilized starting in September at 43.1, 41% higher than the all-time low. November 2024 prices were at the same level compared to a year ago, and December prices are expected to be 3% higher than a year ago.
The chart reveals another intriguing characteristic of the recent pattern in panel prices. As of November 2024, prices have remained for 16 months within a relatively tight range between 41.8 and 45.6, less than a 10% range, and have remained for two months with no change at all. This represents a period of unprecedented stability in LCD TV panel prices, and we expect that prices will remain within this range at least through February.
The drop in LCD TV panel prices in Q3 led to reduced profitability in the third quarter of 2024, as most panel makers saw operating profits decrease (or operating losses increase). With the exception of Samsung Display, the total industry operating profit margin was only 1% in Q3’24, barely better than breakeven, and if BOE is taken out the total industry operating profit margin is negative. So, while stable LCD TV prices are much better than declining prices, the current price level still results in losses for flat panel makers.


