TV用LCD価格月報~5-6月がピーク、第3四半期は下落へ

出典調査レポート Quarterly All Display Fab Utilization Report の詳細仕様・販売価格・一部実データ付き商品サンプル・WEB無料ご試読は こちらから お問い合わせください。
これらDSCC Japan発の分析記事をいち早く無料配信するメールマガジンにぜひご登録ください。ご登録者様ならではの優先特典もご用意しています。【簡単ご登録は こちらから 】
冒頭部和訳
2月に始まったTV用LCD価格の上昇は5-6月に頭打ちとなり、第3四半期には下落に向かう可能性が高い。ここまでの価格上昇は劇的と言うには程遠いものの、採算が厳しいTVパネルメーカーにとっては一息つける状況だった。Q1'24からQ2'24にかけての短期間の上昇はQ4'23に見られた短期間の低迷に続くものであり、今回の「ミニサイクル」はLCD価格が狭いレンジ内で維持されている異例の安定期を意味する。
Q4'23からQ1'24にかけての低稼働率をきっかけに価格は上昇、Q2'24に入って稼働率は上昇し、軟調な需要と相まって価格上昇に終止符が打たれた。DSCCの Quarterly All Display Fab Utilization Report によると、LCDメーカーの稼働率はQ3’23の85%からQ4’23とQ1’24はともに76%に減速した。LCD TFT総投入量はQ4’23に前期比11%減、Q1’24にはさらに前期比2%減となったが、Q2'24は前期比10%増となっている。
Counterpoint Researchの Global TV Tracker によると、TV需要は引き続き低調に推移しており、TV総出荷数はQ1'24に前年比4%減となった。さらに、欧州のスポーツイベントを見越したTVパネル需要の盛り上がりは一段落、出荷済みパネルは海上輸送中あるいはすでに欧州に到着しており、欧州の需要はスポーツイベント終了後に軟化するだろう。
一つ目のグラフは2024年8月までのTV用LCD価格動向の最新予測である。2021年中盤から2022年夏にかけてのパンデミック後の価格急落がグラフに示されている。価格は2022年9月に過去最低値を記録し、Q4’22からQ1’23にかけて緩やかに上昇した後、Q2’23とQ3’23に大幅な上昇を示した。5月の価格は予測に近いもので、6月の価格予測も先月とほぼ同様である。
LCD TV Panel Prices Peaking in May/June and Headed Down in Q3
※ご参考※ 無料翻訳ツール (Google)The rally in LCD TV panel prices which started in February has reached a plateau in May and June and is likely headed down in the third quarter. While the rally has been far from dramatic, it represents a respite for TV panel makers who are challenged for profitability. The short rally in Q1’24-Q2’24 follows a short slump in Q4’23, and together the latest “mini-cycle” represents a period of unusual stability in panel prices, where they have been sustained within a narrow range.
Low utilizations in Q4’23 and Q1’24 helped start the rally, and higher utilizations in Q2’24 have combined with soft demand to bring the rally to an end. Based on DSCC’s Quarterly All Display Fab Utilization Report, LCD makers slowed their utilization from 85% in Q3’23 to 76% in both Q4’23 and Q1’24. Total LCD TFT input declined 11% Q/Q in Q4 and another 2% Q/Q in Q1’24 but is increasing by 10% Q/Q in Q2’24.
On the demand side, TV demand has remained tepid, with overall TV shipments declining 4% Y/Y in Q1’24, according to the Counterpoint Research Global TV Tracker. Furthermore, the boost in demand for TV panels in anticipation of European sporting events has played out – those shipments are on the water or have arrived in Europe, and European demand will soften after the sporting events are finished.
The first chart here highlights our latest TV panel price update with a forecast to August 2024, starting with the tail end of the post-pandemic price plunge which ran from mid-2021 to summer 2022. Prices hit their all-time lows in September 2022 and increased modestly in Q4’22 and Q1’23 before larger price increases covered Q2’23 and Q3’23. Prices for May came in close to our expectations, and our forecast for June prices are mostly unchanged from last month.
LCD TV Panel Prices
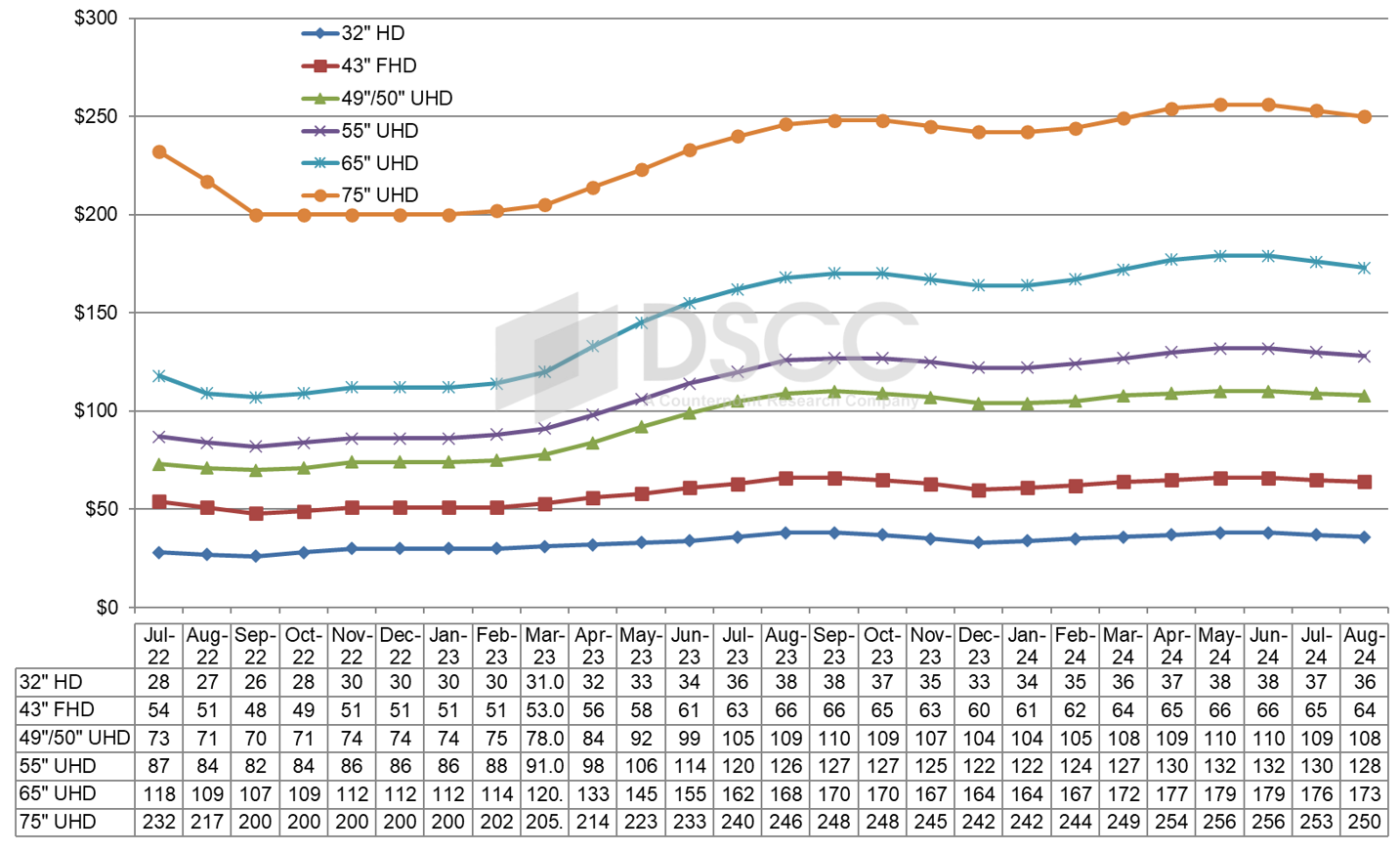
Prices in Q1’24 were nearly flat on average Q/Q, with some sizes showing small Q/Q declines and a few showing small Q/Q increases, but the pattern of prices in Q1 sets up a robust average price increase in Q2. Prices in Q1 were increasing from January to March, so prices in Q2 start higher than the Q1 average and increase from there, so we estimate that average Q2 prices will be 5.5% higher than Q1.
As we look at pricing on an area basis, we are seeing a pattern characteristic of a supply constraint. The smallest TV panel size in our index, 32”, is the ‘canary in the coal mine’ of pricing in the industry. The prices for 32” panels are the first to go up with a supply constraint and are the first to go down in an oversupply. We have seen that pattern bear out in the Q1'24-Q2’24 rally and forecast that pattern in the coming Q3’24 slump.
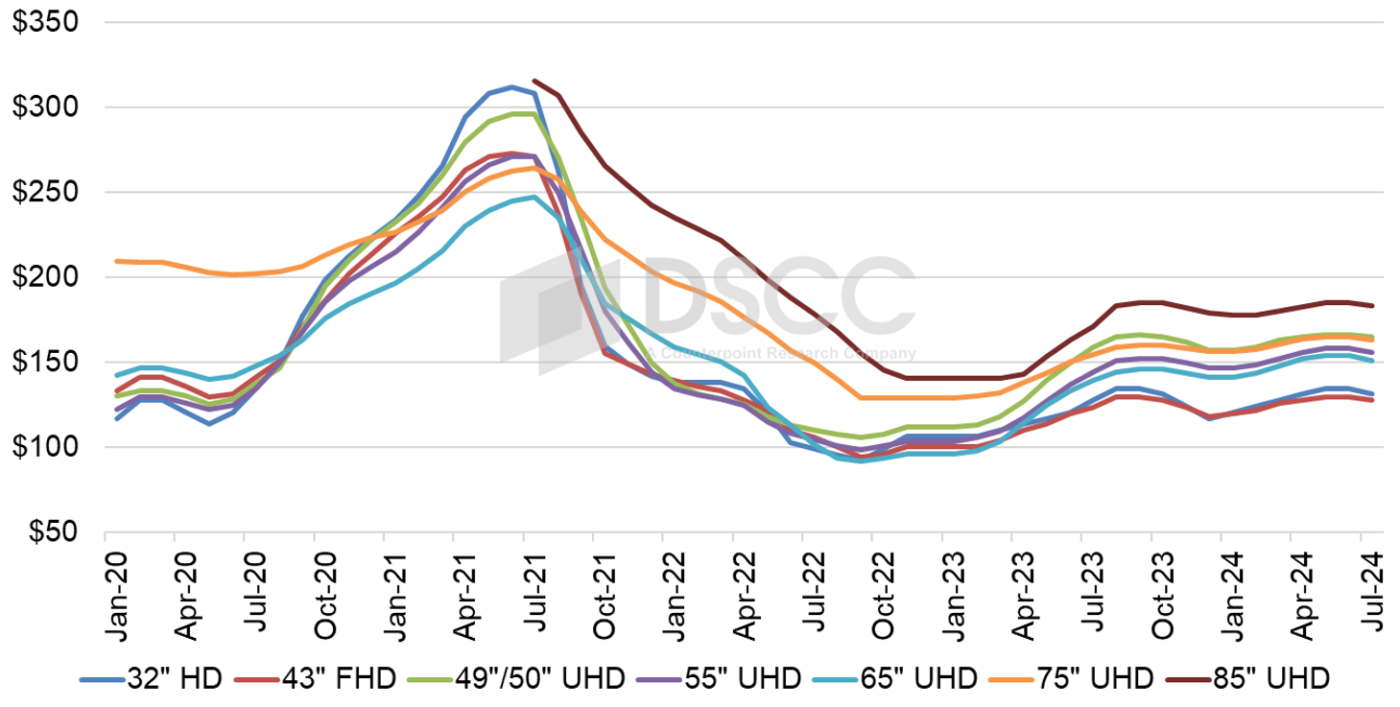
At the most recent low point in December 2023, 32” and 43” panels had the lowest area price at $117 and $118 per square meter, respectively, but area prices were higher for 65” ($141), 55” ($146), 75” ($156) and 49/50” ($157). The area price premium for 65” panels over 32” panels was 21% in December, but with our current outlook it is reduced to 14% in June.
The prices for 49”/50” have been especially strong in this up-cycle, while prices for 43” panels are now the lowest in the industry. The premium for 49”/50” over 43” increased to 28% in May and is stable in June, which favors panel makers with Gen 8.5 capacity at the expense of those with Gen 10.5 capacity. Gen 10.5 fabs can make 43” very efficiently with an 18-up configuration, but do not have an efficient cut for 49”/50”, while Gen 8.5 fabs can make 49”/50” panels efficiently with an 8-up configuration.
Monthly Area Prices per Square Meter for LCD TV Panels
Our final chart in this sequence shows our LCD TV panel price index, taking a longer view from 2015 through August 2024. The price increases in Q3 2023 brought our index up to a peak of 44.8 in September 2023, an increase of 47% compared to the low of 30.5 in September 2022. The index declined to 41.8 in December, which was down 7% from the recent peak but still up 29% Y/Y and up 37% compared to the all-time low. Prices are peaking in May/June 2024 at 45.6, slightly higher than last year’s peak and 50% higher than the all-time low of September 2022.
LCD TV Panel Price Index
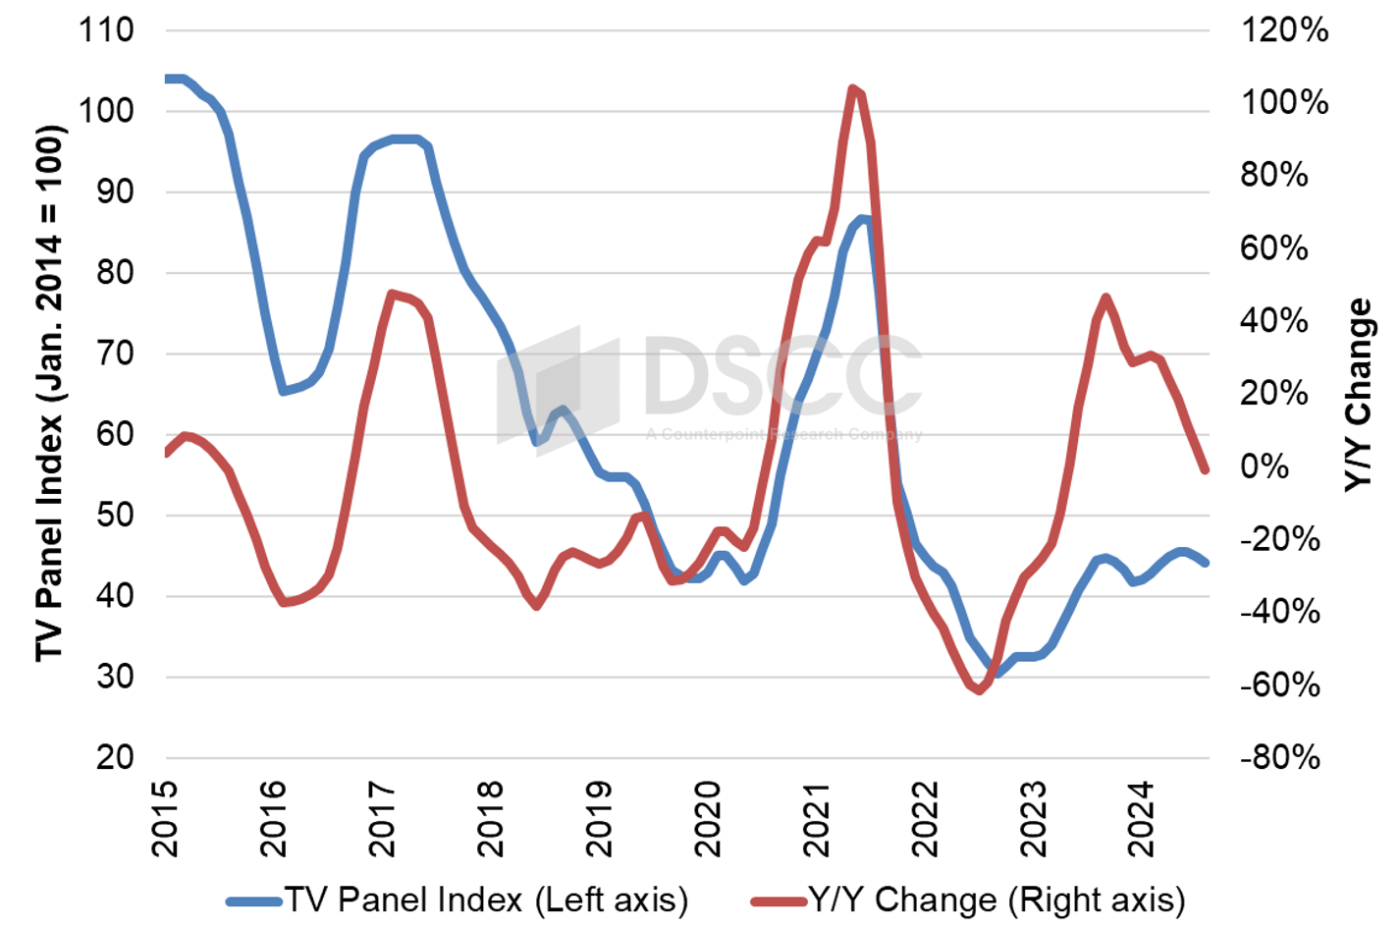
The chart reveals another intriguing characteristic of the recent pattern in panel prices. As of June 2024, prices have fallen with a relatively tight range from 41.8 to 45.6, less than 10%. This represents a period of stability in LCD TV panel prices not seen since at least 2015.
The higher LCD TV panel prices helped panel makers to improved profitability in the first quarter of 2024, as Chinese panel makers focused on large-screen panels eked out a small profit. The two big Taiwan panel makers, Innolux and AUO, continued to report losses in Q1 but both companies gave optimistic guidance for Q2, and the Q2 price increases may have brought them into the black for the quarter.
Restraint in utilization allowed panel makers to generate a short-term uptick, but the industry’s capacity still far outstrips the likely demand for the foreseeable future. Panel makers will need to continue their disciplined ways to minimize the down cycle in the second half of the year.
出典調査レポート Quarterly All Display Fab Utilization Report の詳細仕様・販売価格・一部実データ付き商品サンプル・WEB無料ご試読は こちらから お問い合わせください。