TV用LCD価格月報~第3四半期に下落開始

出典調査レポート Quarterly All Display Fab Utilization Report の詳細仕様・販売価格・一部実データ付き商品サンプル・WEB無料ご試読は こちらから お問い合わせください。
これらDSCC Japan発の分析記事をいち早く無料配信するメールマガジンにぜひご登録ください。ご登録者様ならではの優先特典もご用意しています。【簡単ご登録は こちらから 】
冒頭部和訳
2月に始まったTV用LCD価格の上昇は5-6月に頭打ちとなり、第3四半期に入って下落に転じている。ここまでの価格上昇は劇的と言うには程遠かったが、採算が厳しいTVパネルメーカーにとっては一息つける状況だった。過去に多く見られた展開とは異なり、LCD価格の急激な悪化はなく、少なくともQ3'24は緩やかな下落になるものと見られる。このQ3の低迷は、Q4'23に見られた短期間の低迷とQ1'24からQ2'24にかけての短期間の上昇に続くものであり、今回の「ミニサイクル」はLCD価格が狭いレンジ内で維持されている異例の安定期を意味する。
Q4'23からQ1'24にかけての低稼働率をきっかけに価格は上昇、Q2'24に入って稼働率は上昇し、軟調な需要と相まって価格上昇に終止符が打たれた。DSCCの Quarterly All Display Fab Utilization Report によると、LCDメーカーの稼働率はQ3’23の85%から、Q4’23とQ1’24はともに76%に減速した。LCD TFT総投入量はQ4’23に前期比11%減、Q1’24にはさらに前期比2%減となったが、Q2'24は前期比10%増だった。Q3'24の稼働率は79%まで減速、投入面積は前期比5%減になると予測されている。
LCD TV Panel Prices Starting to Decline in Q3
The rally in LCD TV panel prices which started in February peaked in May and June and panel prices are headed down as we start the third quarter. While the rally was far from dramatic, it represented a respite for TV panel makers who are challenged for profitability. Unlike many former transitions, we do not expect a rapid deterioration in panel prices but rather a soft decline, at least in Q3’24. This Q3 slump follows a short rally in Q1’24-Q2’24 which followed a short slump in Q4’24, and together these “mini-cycles” represent a period of unusual stability in panel prices, where they have been sustained within a narrow range.
Low utilization in Q4’23 and Q1’24 helped start the rally, and higher utilization in Q2’24 have combined with soft demand to bring the rally to an end. Based on DSCC’s Quarterly All Display Fab Utilization Report, LCD makers slowed their utilization from 85% in Q3’23 to 76% in both Q4’23 and Q1’24. Total LCD TFT input declined 11% Q/Q in Q4 and another 2% Q/Q in Q1’24 but increased by 10% Q/Q in Q2’24. We expect utilization to slow down to 79% in Q3’24 and area input to decline by 5% Q/Q.
On the demand side, TV demand has remained tepid, with overall TV shipments declining 4% Y/Y in Q1’24, according to the Counterpoint Research Global TV Tracker. Furthermore, the boost in demand for TV panels in anticipation of European sporting events has played out – those shipments are on the water or have arrived in Europe, and European demand will soften after the sporting events are finished. Reports from the “618” shopping festival in China suggested that demand there remains tepid at best.
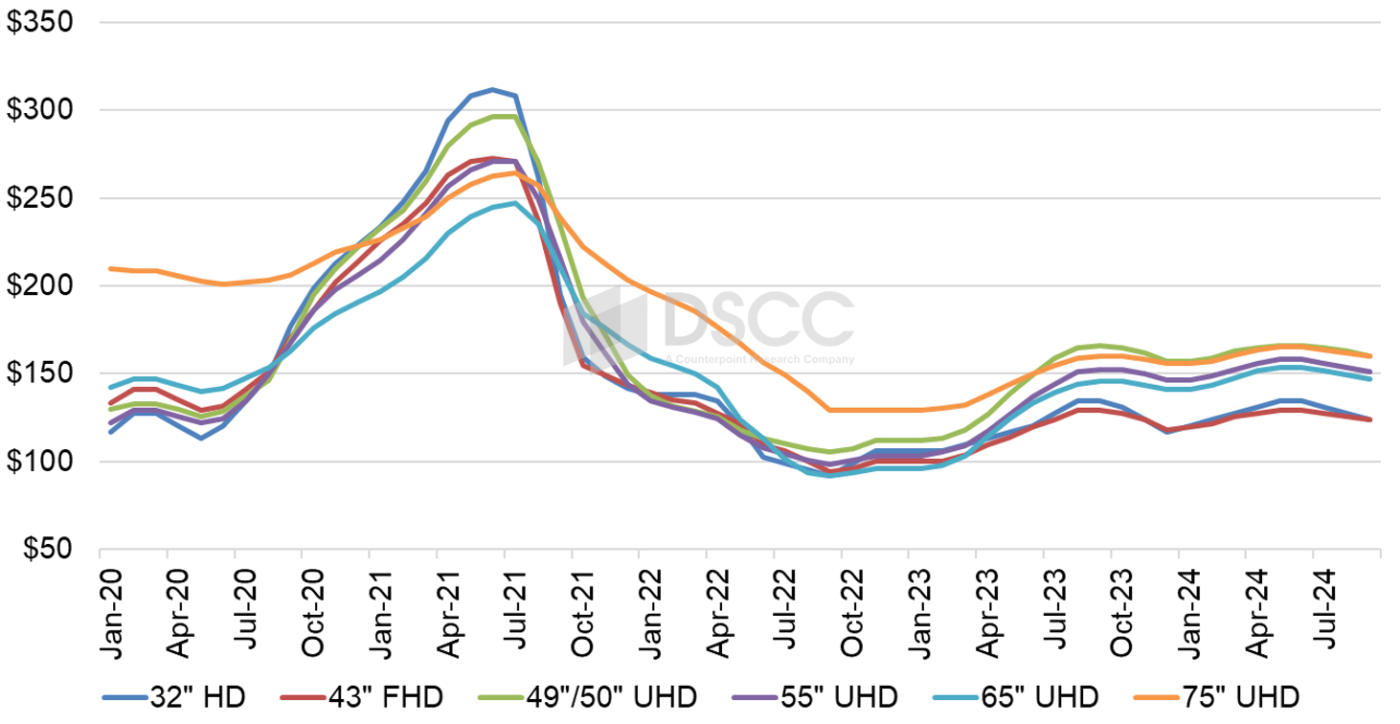
The first chart here highlights our latest TV panel price update with a forecast out to September 2024, starting with the first post-pandemic rally which started after prices hit their all-time lows in September 2022. Prices increased modestly in Q4’22 and Q1’23 before larger price increases covered Q2’23 and Q3’23, followed by a mild slump in Q4’23 and a mild rally in Q1’24-Q2’24. Prices for June came in close to our expectations, and our forecast for July prices are mostly unchanged from last month.
LCD TV Panel Prices
Prices in Q1’24 were nearly flat on average Q/Q, with some sizes showing small Q/Q declines and a few showing small Q/Q increases, but Q2 saw a robust average price increase of 5.5% Q/Q. Because prices peaked at the end of the second quarter, the average price increase in Q3 is a more modest 2.6%, so average Q3 prices will remain higher than Q1.
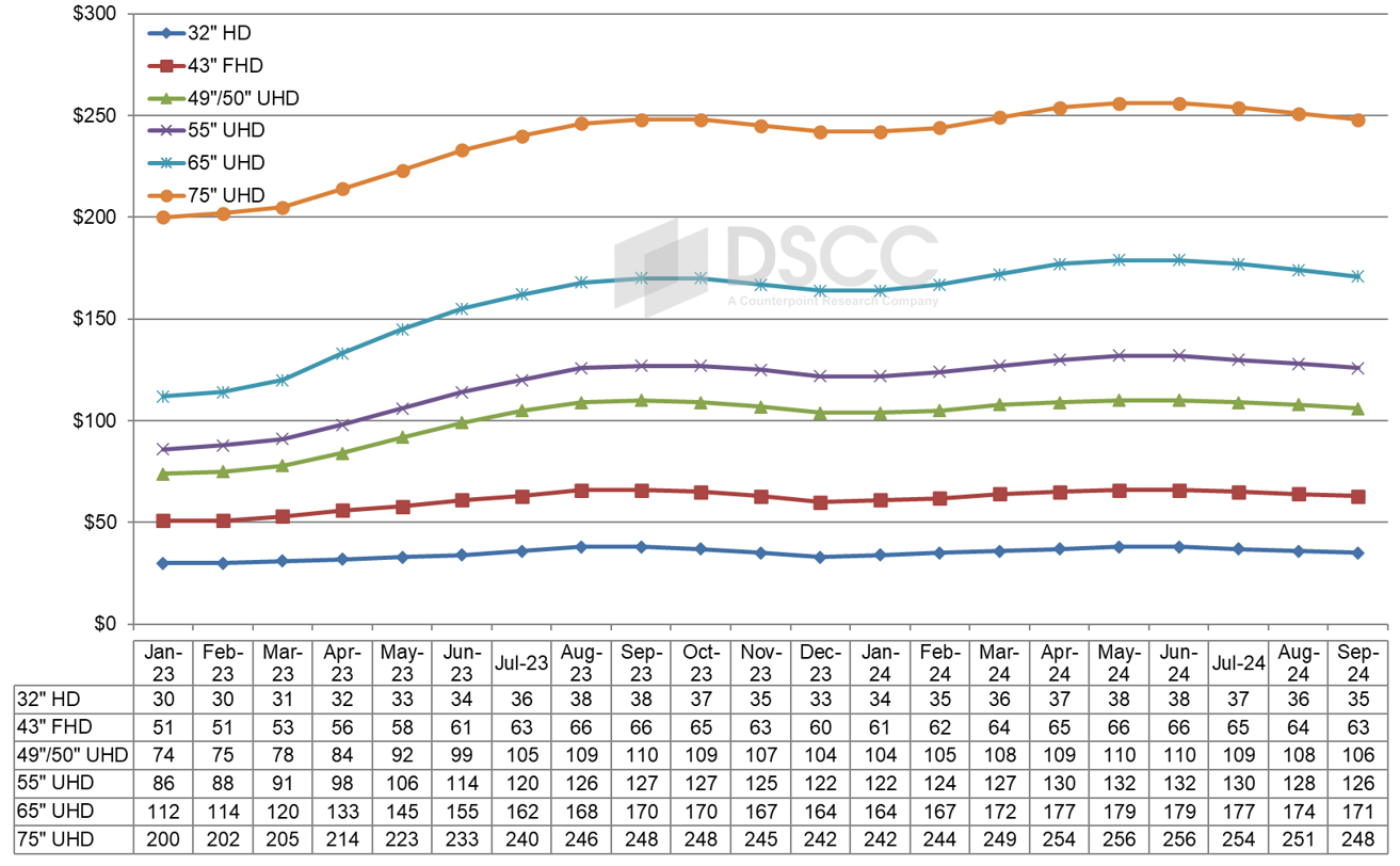
As we look at pricing on an area basis, we are seeing a pattern characteristic of a supply constraint. The smallest TV panel size in our index, 32”, is the ‘canary in the coal mine’ of pricing in the industry. The prices for 32” panels are the first to go up with a supply constraint and are the first to go down in an oversupply. We have seen that pattern bear out in the Q1’24-Q2’24 rally and forecast that pattern in the coming Q3’24 slump.
At the most recent low point in December 2023, 32” and 43” panels had the lowest area price at $117 and $118 per square meter, respectively, but area prices were higher for 65” ($141), 55” ($146), 75” ($156) and 49/50” ($157). The area price premium for 65” panels over 32” panels was 21% in December, but it was reduced to 14% in June.
The prices for 49”/50” were especially strong in this up-cycle, while prices for 43” panels have been the lowest in the industry. The premium for 49”/50” over 43” started the year at 31% in January and declined slightly during the first-half price rally to 28% in May and June but is expected to increase again to 30% in September. A bigger premium for 49”/50” over 43” favors panel makers with Gen 8.5 capacity at the expense of those with Gen 10.5 capacity. Gen 10.5 fabs can make 43” very efficiently with an 18-up configuration, but do not have an efficient cut for 49”/50”, while Gen 8.5 fabs can make 49”/50” panels efficiently with an 8-up configuration.
Monthly Area Prices per Square Meter for LCD TV Panels
Our final chart in this sequence shows our LCD TV panel price index, taking a longer view from 2015 through September 2024. The price increases in Q3’23 brought our index up to a peak of 44.8 in September 2023, an increase of 47% compared to the low of 30.5 in September 2022. The index declined to 41.8 in December, which was down 7% from the recent peak but still up 29% Y/Y and up 37% compared to the all-time low. Prices peaked again in May/June 2024 at 45.6, slightly higher than last year’s peak and 49% higher than the all-time low of September 2022. We now expect prices to fall to 43.6 in September 2024.
LCD TV Panel Price Index
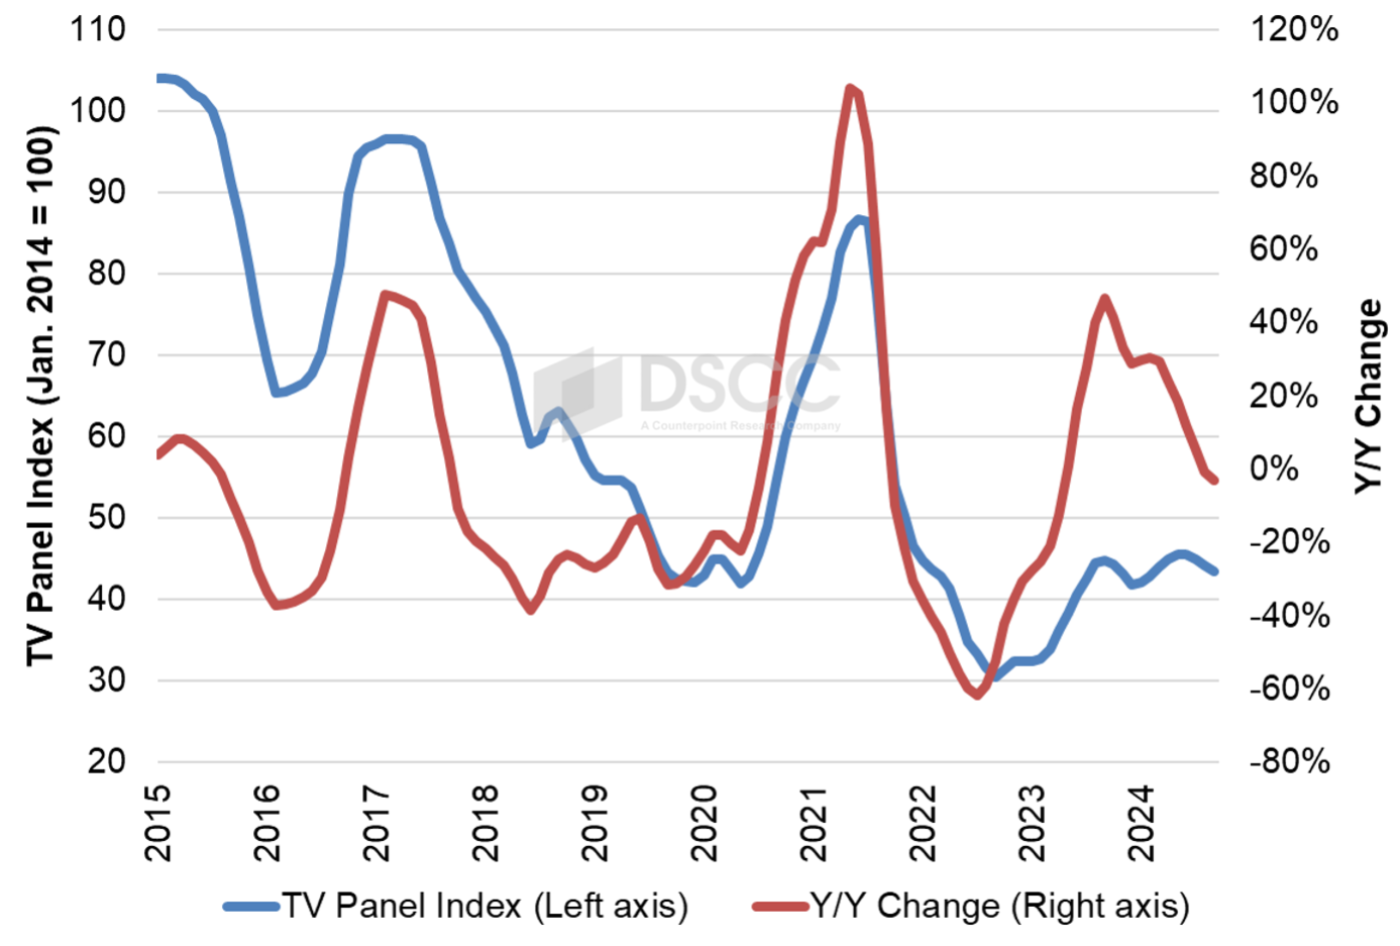
The chart reveals another intriguing characteristic of the recent pattern in panel prices. As of June 2024, prices have remained for a full year within a relatively tight range from 41.8 to 45.6, less than 10%. This represents a period of stability in LCD TV panel prices not seen since at least 2015, and we expect that prices will remain within this range at least through September.
The higher LCD TV panel prices helped panel makers to improved profitability in the first quarter of 2024, as Chinese panel makers focused on large-screen panels eked out a small profit. The two big Taiwan panel makers, Innolux and AUO, continued to report losses in Q1 but both companies gave optimistic guidance for Q2, and the Q2 price increases may have brought them into the black for the quarter. Both companies report their Q2 earnings results at the end of the month.
Restraint in utilization allowed panel makers to generate a short-term uptick, but the industry’s capacity still far outstrips the likely demand for the foreseeable future. Panel makers will need to continue their disciplined ways to minimize the down cycle in the second half of the year.
出典調査レポート Quarterly All Display Fab Utilization Report の詳細仕様・販売価格・一部実データ付き商品サンプル・WEB無料ご試読は こちらから お問い合わせください。