Q3’24のFPDメーカー業績レビュー~VisionoxとHannStarは赤字継続、Samsung Displayは増益
これらDSCC Japan発の分析記事をいち早く無料配信するメールマガジンにぜひご登録ください。ご登録者様ならではの優先特典もご用意しています。【簡単ご登録は こちらから 】
冒頭部和訳
先週、上場FPDメーカーのなかで最も小規模であるVisionoxとHannStarの2社がQ3’24の決算発表を行った。本稿では、先週のSamsung Electronicsの分析に加え、Samsung Displayの業績についてもレビューする。
VisionoxとHannStarはともに小型ディスプレイに重点を置いており、両社ともQ3’24も引き続き営業損失を報告した。VisionoxはEBITDAマージンがプラスでQ4’22以来最高の粗利益率を達成するなど、収益性向上の兆しを見せたが、HannStarは依然として大幅な赤字が続いている。一方、Samsung Displayは、QD-OLEDを製造する赤字事業部門を抱えているにもかかわらず、Q3’24も再び、FPD業界で圧倒的な収益性を誇る企業であることを示した。
Panel Maker Q3’24 Earnings: Visionox and HannStar Keep Losing Money but Samsung Display Profit Increases
Last week, two of the smallest publicly traded flat panel display makers, Visionox and HannStar, released their financial reports for the third quarter of 2024. In this article we also add a review of Samsung Display’s results, adding to our analysis of Samsung Electronics last week.
Both Visionox and HannStar focus on smaller displays, and both companies continued a long string of operating losses in Q3’24. Visionox showed some promise of profitability with positive EBITDA margins and the best gross margin since Q4’22, but HannStar remains deeply in the red. Meanwhile, Samsung Display demonstrated again in Q3’24 that it is by far the most profitable company in the flat panel display industry, despite carrying a loss-making business segment making QD-OLED panels.
Visionox
Visionox (GVO) reported a net loss in Q3’24 of CNY 620M (-$87M) on revenues of CNY 1.9B ($267M). GVO reported an operating loss in Q3’24 of CNY 489M (-$68M), compared to an operating loss in Q2'24 of CNY 589M and an operating loss in Q3'23 of CNY 1040M.
GVO revenues decreased 9% Q/Q but increased 36% Y/Y in $US . The net loss compares to a net loss of CNY 546M in Q2'24 and a net loss of CNY 905M in Q3'23. Visionox has reported 14 consecutive quarters of net losses.
GVO gross margin improved from -9% in Q2'24 to -3% in Q3'24. GVO has reported negative gross margins in seven consecutive quarters. GVO net margin worsened Q/Q from -26% to -32%% but EBITDA margin improved Q/Q from +1% to +6%.
GVO inventory increased 36% Q/Q and inventory days increased from 24 to 36. GVO debt decreased by 1% while equity decreased by 7% Q/Q. Debt/equity increased from 185% to 196% and net debt/equity increased from 91% to 116%.
Roughly two-thirds of GVO's total debt of CNY 16.7B is current debt or the current portion of long-term debt, due within one year.
GVO reported capital expenditures in Q3'24 of CNY 92M ($13M). GVO reported negative cash flow from operations of CNY 670M (-$94M), compared to CNY +304M in Q2'24 and CNY -240M in Q3'23. Free cash flow was negative CNY 762M (-$106M).
In Q4'23, Q1'24 and Q2'24, GVO realized positive cash flow mainly by changes in working capital - specifically, an increase in accounts and notes payable. In Q3'24, GVO reduced its accounts and notes payable by CMY 1.1B, a big factor in the negative operating cash flow. Even with the reduction, the number of days payables is equivalent to a full year.
HannStar
HannStar reported a net loss of TWD 1.47B (-$46M) on revenues of TWD 2.39B ($74M). HannStar’s revenues increased 13% Q/Q but decreased 28% Y/Y. The net loss compares with a net loss of TWD 1.01B (-$31M) in Q2'24 and a net loss of TWD 1.08B (-$34M) in Q3'23. The net loss was the company's ninth consecutive quarterly loss, but revenues increased from Q2'24, which was the lowest point in at least 10 years.
HannStar reported an operating loss of TWD 1.3B (-$41M), which compares to an operating loss of TWD 1.7B in Q2'24 and an operating loss of TWD 1.1B in Q3'23. Gross, operating and EBITDA margins all improved Q/Q by between 22% and 26% while pre-tax and net margins worsened by 14% Q/Q.
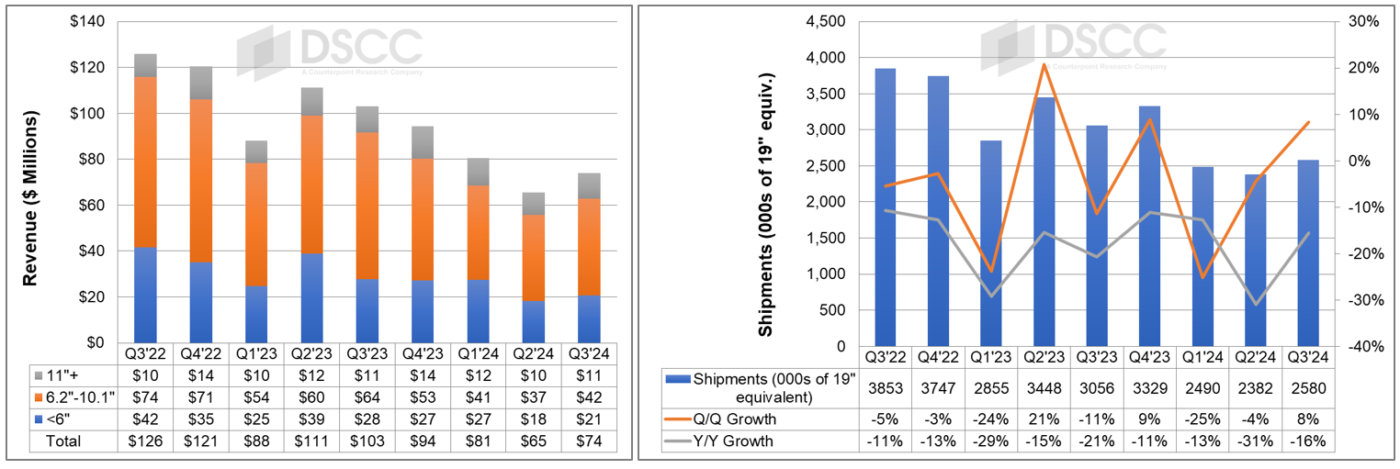
In Q3'24, HannStar area shipments increased by 8% Q/Q but decreased by 16% Y/Y to 2.58M of 19” equivalents. The 19” panel size is equivalent to 0.112 square meters, so area shipments were equivalent to 0.29M square meters.
Product mix was identical to the mix in Q2'24, as revenues were up 13% Q/Q for all screen sizes. S/M unit shipments increased 13% Q/Q and 30% Y/Y to 63.9M. ASPs per 19" equivalent were up 4% Q/Q but down 15% Y/Y at $29.
Area ASP is equivalent to $258 per square meter.
HannStar maintains a clean balance sheet with very low debt and debt decreased by 7% Q/Q but increased by 59% Y/Y. HannStar debt to equity held steady at 9% Q/Q and net debt/equity decreased from 6% to 5%. HannStar reported a negative cash flow from operations of TWD 583M (-$18M) and capital expenditures of TWD 387M ($12M). HannStar free cash flow was again negative at TWD 970M (-$30M). HannStar has reported 10 consecutive quarters of negative FCF.
Samsung Display
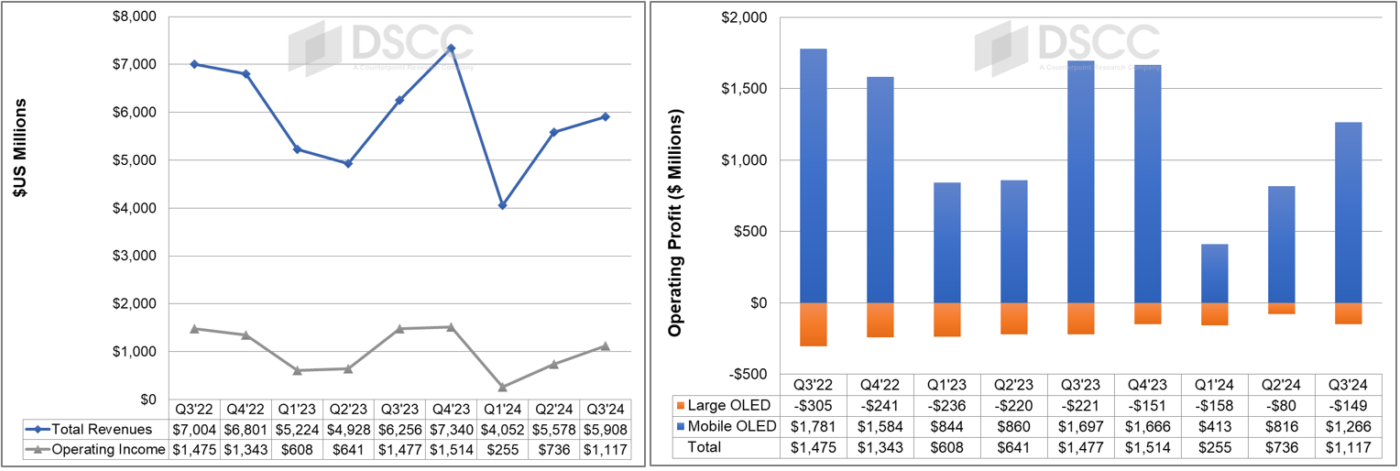
Samsung's Display business earned operating profits of KRW 1513B ($1.12B) on revenues of KRW 8.0T ($5.9B). Revenues increased 6% Q/Q but decreased 6% Y/Y while operating profits increased 52% Q/Q but decreased 24% Y/Y. For Mobile displays, profits increased as both sales and utilization rates increased sequentially. For display in the third quarter, the smaller screen portion of revenue remained over 90%, similar to Q2.
Samsung Display revenues in its Mobile business increased 8% Q/Q but decreased 6% Y/Y, while revenues in its Large screen OLED business decreased 30% Q/Q but increased 8% Y/Y. Samsung Display earned KRW 1.7T ($1.27B) of operating profit from its Mobile business, an increase of 55% Q/Q but a decrease of 25% Y/Y. Samsung Display’s Large screen OLED business booked a loss of KRW 202B (-$149M), worse than a loss of KRW 110B in Q2’24 but an improvement over the loss of KRW 290B in Q3’23.
Samsung Display capex in Q3’24 was KRW 1T ($738B), a decrease of 44% Q/Q but an increase of 39% Y/Y. Samsung Display investment is focused on new fabs for mobile display and strategic investments enhancing production lines.
Samsung expects to maintain its leadership in foldable and high-end smartphones with innovative OLED technologies such as low power consumption and high resolution for AI devices.
Looking toward Q4 and 2025, in the mobile panel business Samsung expects sluggish demand for smartphones to continue into the first quarter, along with sales growth in IT and auto business. Samsung's outlook for mobile panels is conservative as it sees rising competition among panel makers. In the large panel business Samsung will improve production efficiency and keep striving to expand sales compared to Q3. For 2025, Samsung expects overall growth in the smartphone market will be limited, but OLED penetration rate will continue to increase.


