トランプ関税で米国エレクトロニクス業界は再編へ~最新輸入データが中国への依存継続を示唆
トランプ関税で米国エレクトロニクス業界は再編へ~最新輸入データが中国への依存継続を示唆
ドナルド・トランプ氏が第47代米国大統領に選出された。選挙公約が実行に移されれば、ディスプレイを使用する電子製品のサプライチェーンには大きな変化が迫られることになるだろう。ディスプレイサプライチェーンが他地域へと徐々に移行する兆しは見られるものの、中国は依然として米国への電子機器輸入における最重要国だ。もしトランプ氏が中国からの輸入品に60%の関税を課すという公約を実行に移せば、輸入業者にとっては数十億ドルの負担となり、おそらくは他国への生産移転を余儀なくされるだろう。
米国国際貿易委員会 (US ITC) は11月8日 (金) に2024年9月の詳細な輸入データを発表、これによりQ3’24の概況が明らかになった。今年1月からの9ヵ月間で米国が世界の全ての国から輸入した全品目の総額は2兆4000億ドルで、うち13%にあたる3150億ドルが中国からの輸入だった。
ITCは100類から構成されるHTS (Harmonized Tariff Schedule) コードを用いて輸入品を分類する。最も大きな2つのカテゴリーはいずれもディスプレイ業界に関わる商品である。第84類に分類される商品には機械および機械設備が含まれ、PCはここに含まれる。第85類に分類される商品には電気機械機器という特徴があり、スマートフォン、TV、モニターがここに含まれる。2024年初来9ヵ月間に米国が輸入した第84類品目は3810億ドル、第85類品目は3440億ドルで、そのうち中国からの輸入は第84類品目が590億ドル、第85類品目が840億ドルだった。
現在、PC、モニター、スマートフォンを含むほとんどのディスプレイ用途には、どの国の関税障壁も存在しない。TVについては、メキシコと中国を除くほとんどの国で3.9%の関税が課せられている。メキシコからのTV輸入は米国・メキシコ・カナダ自由貿易協定があるため関税が課せられないが、中国からのTV輸入には7.5%の制裁関税が課せられる。これはトランプ政権が2019年に貿易戦争の一環として開始したもので、バイデン政権になっても引き続き実施されていた。
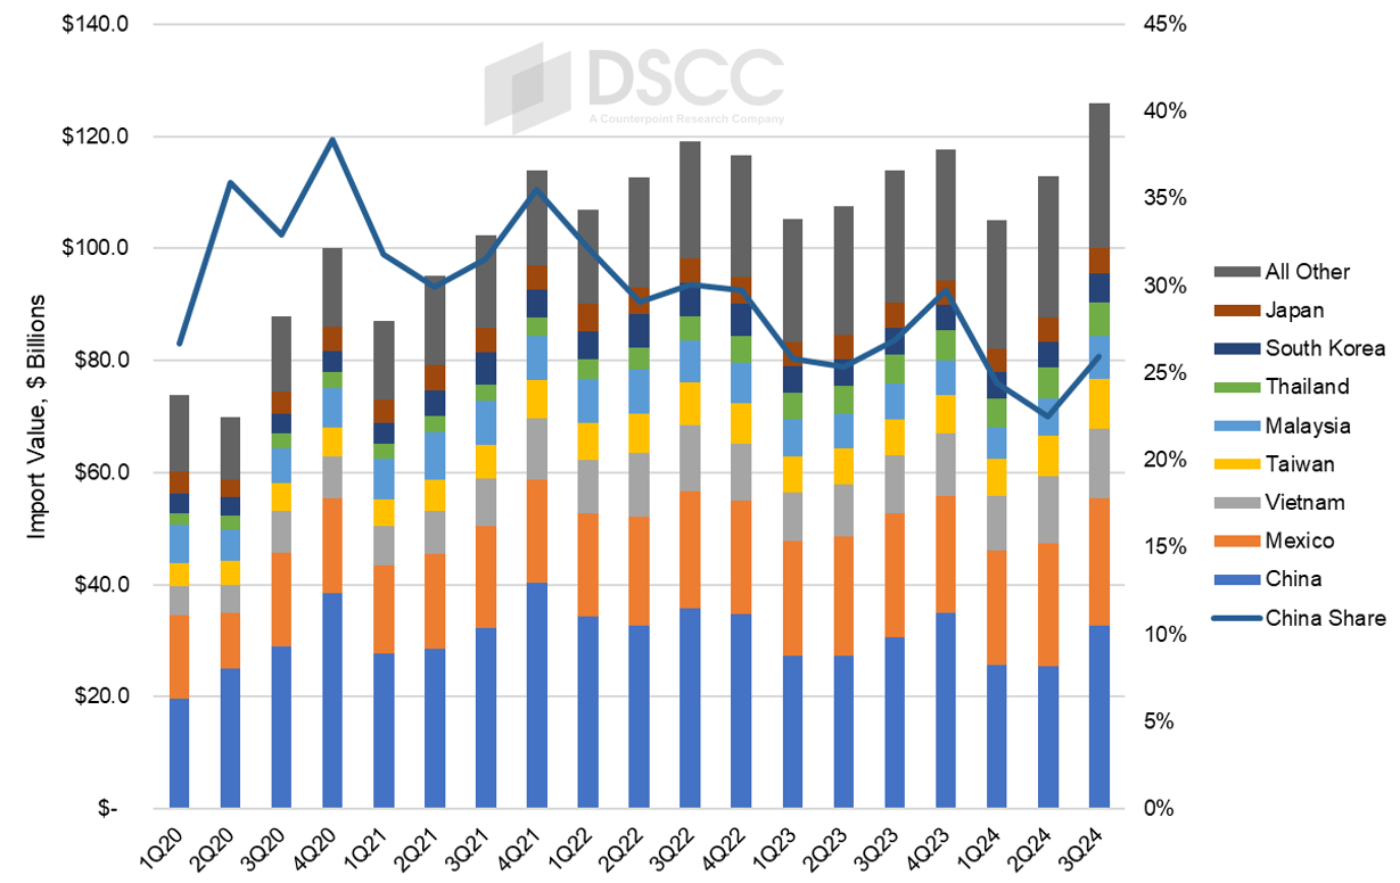
まず、HTS第85類の全品目を対象とした全体像から始めよう。Q3’24の米国の第85類品目輸入額は前年比11%増の1260億ドルだった。これらの電子機器は全輸入額の約15%を占め、一つ目のグラフに示すように、Q3’24の中国からの米国輸入額は327億ドル、第85類輸入品目全体の26%を占めており、依然として最大の供給国となっている。
このグラフが示すように、2020年から2024年にかけて、中国からの輸入のシェアは緩やかに下降しており、毎年第4四半期にピークを迎え、第2四半期に底を打つ季節的なパターンが見られる。Q2'24の中国のシェアは23%で、少なくとも2016年以降では最も低い水準となっている。電子機器輸入に占める中国のシェアは、当時のトランプ大統領が大規模な関税を課すと脅し輸入業者がそれを逃れるべく躍起になったQ4’17に、ピークの47%に達した。
Q3’24の中国のシェアは前年比で1%低下、中国からの第85類品目輸入は7%増で市場全体を下回った。第85類品目の輸入相手国第2位であるメキシコも、輸入が前年比3%増にとどまったためシェアが低下した。シェアを伸ばした国はいずれも東南アジアで、ベトナムは21%、台湾は39%、マレーシアは17%、タイは17%の上昇となっている。
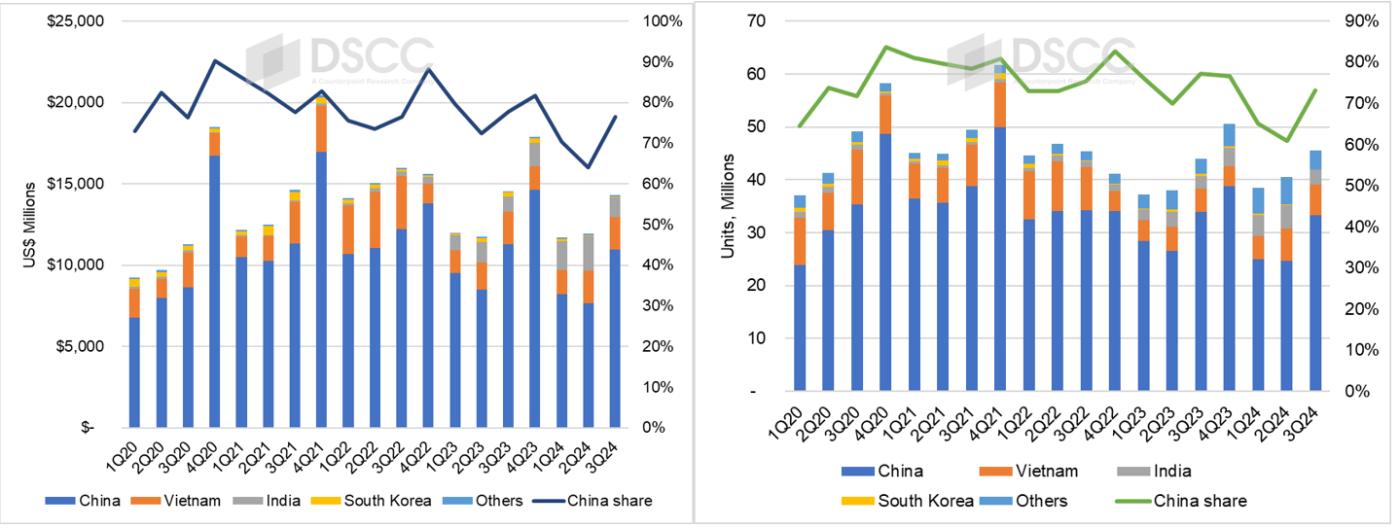
エレクトロニクスのなかで単一カテゴリーとして出荷額が最大であるのはスマートフォンだが、このカテゴリーはここ数年、買い替えサイクルの長期化にともなって需要が全般的に減少している。Q3’24のスマートフォン輸入は数量ベースで前年比2%増だったが、平均価格が前年比4%安の335ドルとなったため、金額ベースでは前年比2%減となった。
Q3'24の中国からのスマートフォン輸入は、数量ベースで2%減、金額ベースで3%減と、市場全体に比べて減少幅が大きかった。2023年に減速したベトナムからの輸入は数量ベースで前年比32%増となったが金額ベースでは前年比3%増にとどまっており、ベトナムからの輸入スマートフォンの平均価格はQ3'23の452ドルからQ3'24には353ドルに下落している。インドからのスマートフォン輸入は数量ベースで前年比21%増、金額ベースで前年比26%増、インドからの輸入スマートフォンの平均価格はQ3'23の406ドルに対しQ3'24は424ドルとなっている。スマートフォン輸入に占める中国のシェアは、数量ベースでは4ポイント減の73%、金額ベースでは1ポイント減の77%である。
モバイルPCカテゴリーにはノートPCとタブレットが含まれる。このカテゴリーの全体像は、パンデミック後の減速を経て業界が安定してきたことを示している。モバイルPC輸入は2022年に20%減少し2023年にはさらに9%減少したが、2024年初来9ヵ月間の輸入は2023年に比べ5%増加している。このカテゴリーでは2023年以降、中国からの明らかなシフトが見られるが、Q3'24も中国が依然、圧倒的な供給国となっている。
米国のPC輸入に占める中国のシェアは2022年まで90%以上を維持していたが、2023年には84%に低下し、Q3'24には数量ベースで73%、金額ベースで66%に低下した。Q3'24のベトナムからのPC輸入数は前年比60%増の570万台、輸入額は前年比56%増の34億ドルとなっており、ベトナムからの輸入PCの平均価格はQ3'23の624ドルからQ3'24には607ドルに下がっている。
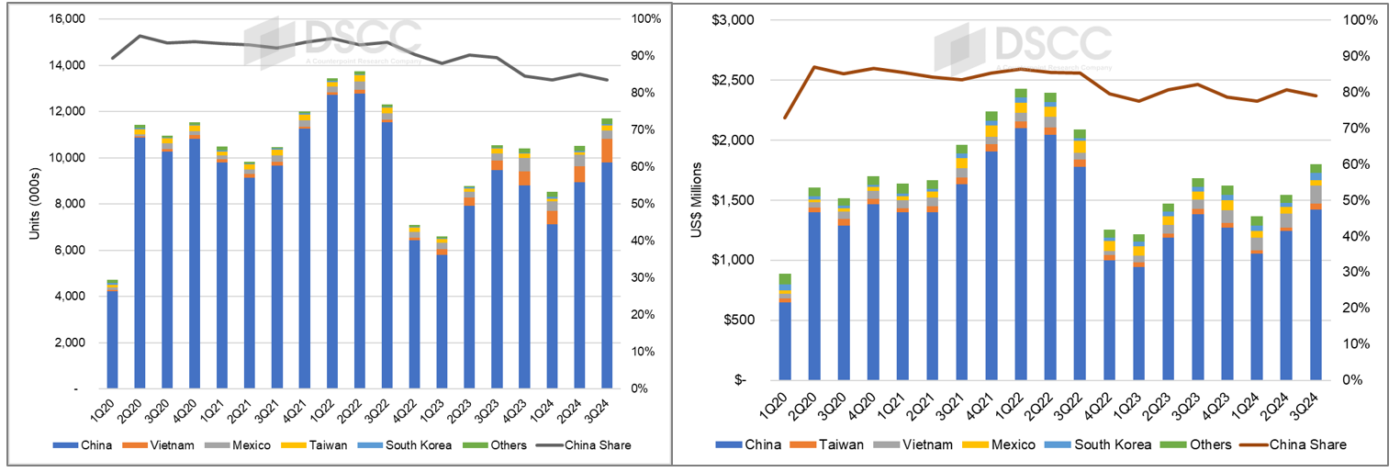
PC同様、モニターでも中国は圧倒的シェアを維持しているものの、シェアの浸食が見られる。Q3'24の中国からのモニター輸入は数量ベースで前年比4%増、金額ベースで前年比3%増となっており、中国のシェアは数量ベースで前年同期の90%から84%に低下、金額ベースでは前年同期の82%から79%に低下している。ベトナムからのモニター輸入は数量ベースで前年比139%増、金額ベースで前年比90%増となっており、ベトナムからの輸入モニターの平均価格は187ドルから148ドルに下がった。米国の輸入モニター全体の平均価格は前年比4%安の154ドルとなっている。
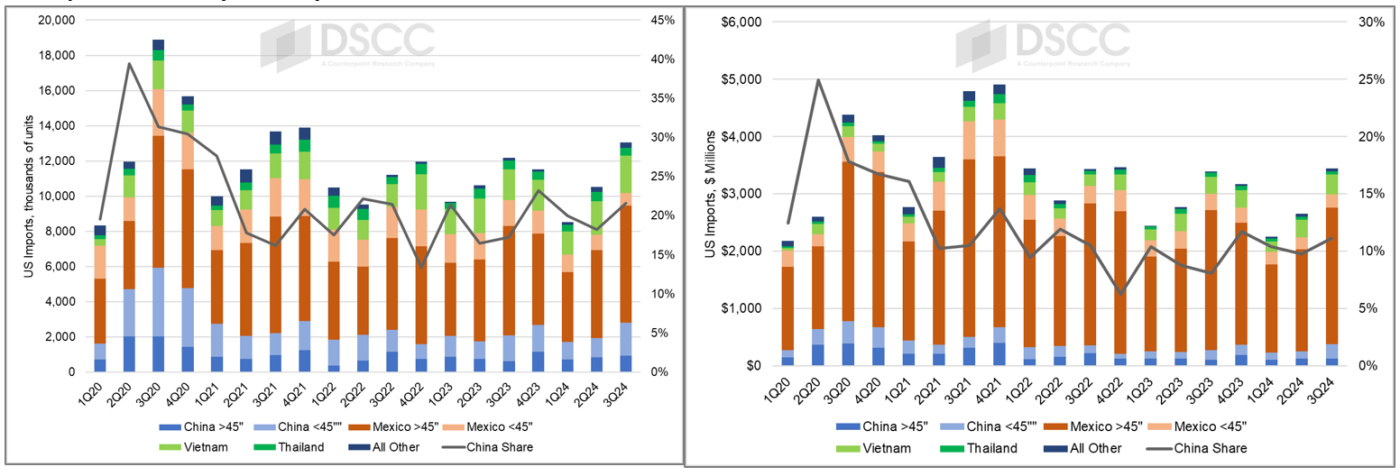
TVカテゴリーでは、中国はこれまで、米国の輸入相手国としてPCや携帯電話ほど圧倒的な存在ではなかったものの、中国のシェアは貿易戦争に至るまでは上昇し数量ベースで50%を超えていた。米国のTV輸入に占める中国のシェアは2018年から2021年にかけて右肩下がりに低下したが、数量ベースで20%前後、金額ベースで10%前後で安定しているようだ。
Q3'24の米国のTV輸入を見ると、すべての国からの輸入数は前年比7%増の1310万台、平均価格は279ドルから264ドルへと前年比で5%低下しており、輸入額は前年比2%増の34億5000万ドルとなった。 中国からの輸入は数量ベースで35%増、平均価格の4%上昇で金額ベースでは40%増加となっている。メキシコからの輸入は数量、金額ともに前年比4%減で、平均価格は355ドルから354ドルへとわずかに下落した。ベトナムからの輸入は数量ベースで22%増、金額ベースでは16%増、平均価格は177ドルから166ドルに下がっている。
中国はほとんどのエレクトロニクス機器カテゴリーにおいて、最終製品の供給国として圧倒的地位を維持しており、トランプ氏が中国からの輸入品すべてに60%の関税を課すという選挙公約を実行に移せば、エレクトロニクス業界は大きな混乱に見舞われるだろう。参考までに、2024年初来9ヵ月間に中国から米国に輸入された第85類品目840億ドルを基準とすると、関税によって500億ドル分のコストが上乗せされることになる (トランプ氏は米国の国庫に500億ドルがプラスされると言うだろう)。中国から輸入された第84類品目590億ドルについては、関税によって350億ドル分のコスト増となる。
別の見方をすれば、中国からの輸入TVに対する関税率は11.4%から71.4%になる。2024年の中国からの輸入TVの平均価格は、関税前価格で136ドルである。現在の11.4%の関税によって価格は151ドルに上昇する。トランプ関税が最大限の引き上げとなれば、価格は233ドルまで上昇することになる。純粋なドルベースでの影響はスマートフォンの方が大きいだろう。Q3'24の中国からの輸入スマートフォンの平均価格は329ドルだった。60%の関税が課せられれば価格は526ドルになり、200%近くの上昇となる。
現実にはこれほどの大幅な価格上昇は起こりそうにない。データに表れているように、エレクトロニクスのサプライチェーンは関税回避のため生産を他国にシフトすることができる。トランプ氏の当選は、最終市場向け商品の生産が中国からシフトするパターンを加速させる可能性が高い。
ただし、短期的にはトランプ氏の当選がディスプレイ業界の刺激要因となるかもしれない。Q4’17には関税適用前に輸入業者が駆け込みで米国に商品を殺到させたため、TVやその他の電子機器の輸入が急増した。今後数ヵ月間にそのような熱狂が繰り返され、現行制度下で米国に輸入される電子機器が急増する可能性もある。もしそうなればQ4'24とQ1'25にディスプレイ需要が急騰するかもしれないが、関税導入後は需要が減少するだろう。
[原文] Trump Tariffs Will Reshape the US Electronics Industry: Latest Imports Data Shows Continued Reliance on China
The election of Donald Trump as the 47th US President will force big changes in the supply chain for electronics products using displays if he follows through on campaign promises. Although there are signs that the display supply chain is slowly migrating to other regions, China remains the essential country for electronics imports to the US. If Trump follows through on his promise to implement a 60% tariff on imports from China, it will cost importers billions of dollars, likely forcing them to shift production to other countries.
On Friday, November 8th, the US International Trade Commission (US ITC) released detailed import data for September 2024, allowing for a view of Q3’24. In the first nine months of the year, US imports of all commodities from all countries totaled $2.4T, of which $315B, or 13%, came from China.
The ITC categorizes imports using codes from the Harmonized Tariff Schedule (HTS), composed of 100 chapters. The two biggest categories of commodities are both relevant to the display industry. Chapter 84 commodities, which include machinery and mechanical appliances, include PCs, while chapter 85 commodities are characterized as electrical machinery and equipment, and these include smartphones, TVs and monitors. In the first nine months of 2024, the US imported $381B of chapter 84 goods and $344B of chapter 85 goods, of which $59B of chapter 84 and $84B of chapter 85 goods came from China.
Currently, for most display applications, including PCs, monitors and smartphones, there are no tariff barriers from any country. For TVs, there is a 3.9% tariff from most countries except Mexico and China. TV imports from Mexico have no tariff because of the USMXCA free trade agreement, while TV imports from China have a 7.5% punitive tariff which was initiated by the Trump Administration in 2019 as part of a trade war and which has remained in place for the Biden Administration.
We will start with the big picture, covering all goods in Chapter 85 of the HTS. Chapter 85 goods represented $126B in imports to the US in Q3’24, an increase of 11% Y/Y. These electronics represent about 15% of the value of all imports, and as shown in the first chart here, China remains the biggest supplier of these goods to the US with $32.7B in 3Q’24, representing 26% of all Chapter 85 imports.
As the chart shows, there has been a slow migration downward in the share of China imports from 2020-2024, with a seasonal pattern that peaks in Q4 of each year and bottoms out in Q2 of each year. The China share of 23% in Q2’24 represents the lowest share for China going back at least to 2016. China’s share of electronics imports peaked at 47% in Q4’17 as then-President Trump threatened massive tariffs and importers rushed to beat them.
China’s share in Q3’24 fell by 1% compared to the prior year, and chapter 85 goods from China increased by 7% in that period, less than the overall market. The #2 country for chapter 85 goods, Mexico, also saw its share slip as imports increased only 3% Y/Y. The countries gaining share were all in southeast Asia: Vietnam, Taiwan, Malaysia and Thailand saw chapter 85 import value increase by 21%, 39%, 17% and 17% respectively.
The biggest single revenue category within electronics is smartphones, and that category has seen a general decrease in demand over the last few years as the replacement cycle lengthens. Overall, smartphone unit imports increased by 2% Y/Y in Q3’24 and revenues decreased by the same amount Y/Y as the average price of a smartphone edged down by 4% to $335.
In Q3’24, smartphone imports from China decreased 2% in units and 3% in revenue, a bigger decrease compared with the market. Imports from Vietnam, which slowed down in 2023, increased Y/Y by 32% in units but only 3% in revenue and the average price of a smartphone imported from Vietnam fell from $452 in Q3’23 to $353 in Q3’24. Smartphone imports from India increased 21% in unit terms and 26% in revenue, and the average price of a smartphone from India cost $424 in Q3’24 compared to $406 in Q3’23. China’s share of smartphone imports decreased by four points to 73% in units and by one point to 77% in value.
The mobile PC category includes both notebook PCs and tablets. The big picture of this category is that the industry has stabilized after its post-pandemic slowdown. Mobile PC imports declined by 20% in 2022 and another 9% in 2023, but for the first nine months of 2024, imports are up 5% Y/Y compared to 2023. Here we see a clear shift away from China starting in 2023, but in Q3’24 China remains the dominant supplier.
China’s share of US PC imports remained over 90% through 2022 but China’s share fell to 84% in 2023 and fell to 73% in units and 66% in revenue in Q3’24. In Q3’24, PC imports from Vietnam increased by 60% Y/Y in units to 5.7M and by 56% in revenue to $3.4B, and the average price of a PC import from Vietnam edged down from $624 in Q3’23 to $607 in Q3’24.
Similar to PCs, in monitors China maintains a dominant share but has seen an erosion of share. China’s monitor imports increased 4% Y/Y in unit terms and 3% Y/Y in revenue terms in Q3’24, and China’s share of units slipped from 90% in Q3’23 to 84% in Q3’24 while China’s revenue share decreased Y/Y from 82% in Q3’23 to 79% in Q3’24. Vietnam monitor imports increased by 139% Y/Y in units and by 90% in revenue as the average price of a monitor imported from Vietnam decreased from $187 to $148. Overall, the average price of a monitor imported to the US declined by 4% Y/Y to $154.
In TVs, China was never as dominant as a source of US imports as it was with PCs and phones, but leading up to the trade war, China’s share had been increasing and surpassed 50% in unit terms. China’s share of US TV imports declined steadily from 2018-2021 but appear to have stabilized at about 20% of units and 10% of revenue.
In Q3’24, US TV imports from all countries increased by 7% Y/Y in unit terms to 13.1M and revenues increased by 2% Y/Y to $3.45B as the average price per unit decreased by 5% Y/Y from $279 to $264. Imports from China increased by 35% in unit terms and by 40% in revenue terms as the average price increased by 4%. Imports from Mexico decreased by 4% Y/Y in both units and revenue as the average price per unit edged down from $355 to $354. Vietnam saw its share of US TV imports increase as units increased by 22% and revenue increased by 16% and the average price per unit decreased from $177 to $166.
China remains the dominant supplier across most electronics categories of end devices, so if Trump follows through on his campaign promise to slap a 60% tariff on all goods imported from China, it will greatly disrupt the electronics industry. Using as a reference the $84B in chapter 85 imports from China to the US in the first nine months of 2024, the tariffs would add $50B to the cost (Trump would say it adds $50B to the US treasury). For the $59B in chapter 84 imports from China, the tariffs would add $35B to the cost.
Looked at another way, the added tariff on TVs from China would bring the duty on those imports from 11.4% to 71.4%. The average price of a TV imported from China in 2024 has been $136, before tariffs. Under the current 11.4% tariff, this increases to $151. Under a maximum Trump tariff this would increase to $233. The impact in purely dollar terms would be larger in smartphones. The average price of a smartphone imported from China in Q3’24 was $329. This would increase to $526 with a 60% tariff, an increase of nearly 200%.
In reality, these huge price increases are not likely to happen. As this data shows, the electronics supply chain can shift production to other countries to avoid the tariff. The election of Trump is likely to accelerate the pattern of production shifting away from China for end market goods.
However, in the short term Trump’s election may be an accelerant to the display industry. We saw in Q4’17 that imports of TVs and other electronics soared as importers rushed goods into the US before tariffs came into place. We may see a repeat of that frenzy in the coming months with a surge of electronics imported to the US under the current regime. That could bring a surge in demand for displays in Q4’24 and Q1’25, but it would be followed by a drop in demand once the tariffs are put in place.


