米国TV価格は下落傾向、インフレ全般のクールダウンによる
これらDSCC Japan発の分析記事をいち早く無料配信するメールマガジンにぜひご登録ください。ご登録者様ならではの優先特典もご用意しています。【簡単ご登録は こちらから 】
冒頭部和訳
米国のインフレ率はここ数ヵ月緩やかに低下しており、TV価格は3月、4月と2ヵ月連続で下落するという「通常」のパターンに戻っている。
この分析は、米国労働統計局 (BLS) 発表の最新のC消費者物価指数 (CPI) データに基づいている。BLSは数百単位のカテゴリーのCPI統計を発表しており、現在のデータセットは1996年までさかのぼるが、CPIは1982年-1984年に対して指数化されている。CPIには300を超えるサブインデックス (下位指数) が含まれており、それぞれに経済全体に対するサブインデックスの重要度を示すウェイティング (重み付け) がなされている。たとえば、食料品はCPIの14%を構成しており、ガソリンのウェイティングは4%となっている。TVのウェイティングはわずか0.096%である。
US TV Prices Falling as Overall Inflation Cools
※ご参考※ 無料翻訳ツール (Google)US inflation has been slowly declining in recent months, and TV prices have returned to their “normal” pattern of declining for two months in a row in March and April.
This analysis is based on the most recent data from the US Bureau of Labor Statistics (BLS) Consumer Price Index (CPI). The BLS publishes CPI statistics for hundreds of categories, and its current data set goes back to 1996, but the CPI is indexed to 1982-1984. The CPI includes more than 300 sub-indexes, each with a weighting that indicates the importance of the sub-index to the overall economy. For example, food items comprise 14% of the CPI, and gasoline is weighted at 4%. Televisions have a tiny weighting of only 0.096%.
The April 2024 overall CPI stood at 313.548, up by 0.4% M/M from March 2024 and up 3.4% from April 2023. It was the fourth consecutive month of increases after three months of sequential decreases to close out 2023, with the volatility attributable to energy prices. The 0.4% increase M/M is not commonly reported; the 3.4% Y/Y figure is typically used as the headline for inflation reports. Core inflation edged lower from 3.8% in February and March 2024 to 3.6% in April.
The CPI level of 313.548 means that a standard basket of goods that could be purchased for $100 in 1982-1984 would cost $313.55 for a consumer in April. The CPI for TVs in February 2024 was 1.079, down by 0.016 from March and a new all-time low. This means that a (hypothetical) TV that cost $100 in 1982-1984 would cost $1.08 in April 2024. On a M/M basis TV prices were down 1.5%; if this monthly decrease persisted for a full 12 months it would represent a 16% decrease. The TV sub-index has now decreased for two consecutive months after increasing for five of the six months ending in February 2024, a longer streak than any time except for the pandemic in 2020-2021.
The chart here shows the Y/Y change in the CPI, the familiar headline definition of inflation, and in the CPI sub-index for TV. In the period from 1997-2021, the CPI for TV spent nearly the entire flat panel display era below -10%. For a period of more than 10 years from 2005 to 2017, the CPI for TV was always below -10% and often below -20%.
Y/Y % Change in US Consumer Price Index, 2011-2024
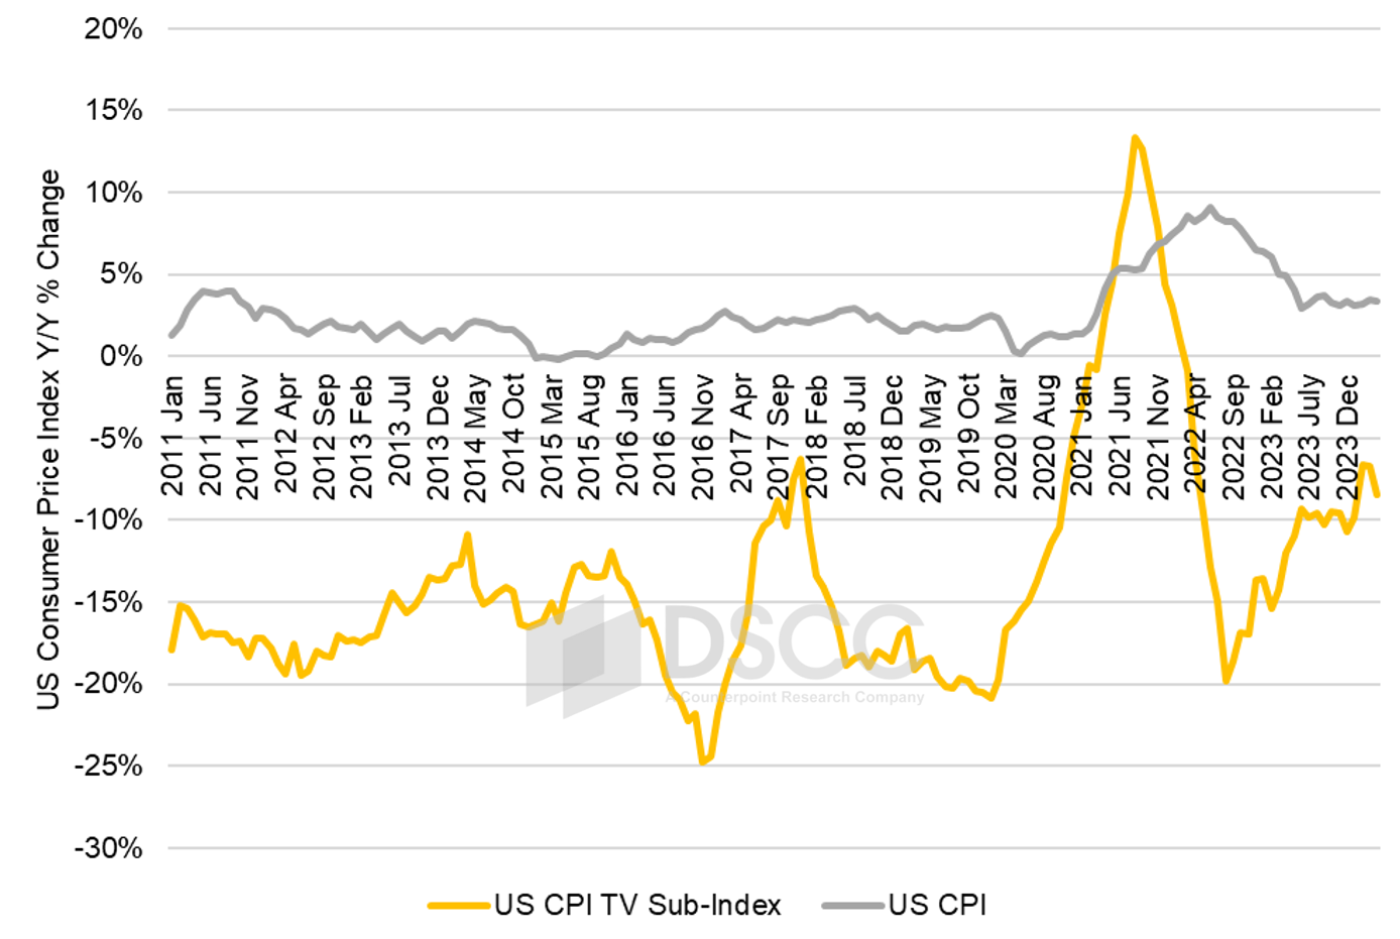
The general CPI in April 2024 increased by 3.4% Y/Y, while the CPI sub-index for TVs in February 2024 decreased by 8.4% Y/Y. TV inflation peaked in August 2021 at 13.3% which was the highest level ever, but it dropped rapidly until it hit a low point of -19.8% in August 2022 and has risen since then. After a nine-month stretch when it hovered in the range of -9% to -11%, the TV index jumped up to -6.7 Y/Y in February, held steady at -6.7% Y/Y in March, and has now headed down again in April.
The increase in LCD TV panel prices which started in mid-2023 flowed through to the retail price as a smaller disinflation that peaked in February/March 2024. Our long-term regression of the TV CPI with DSCC’s panel price index has a best fit with TV prices at a four-month lag to panel prices. That four-month lag makes sense, considering the time it takes to assemble TVs, ship them to the USA, and sell them at retail. Thus, the April retail inflation for TVs of -8.4% corresponds to the December 2024 PPI, which was at +29% Y/Y. The direction of TV prices in April is exactly what the regression model would predict, going down from its recent high. A view at the chart suggests that TV price inflation may go more negative in the coming months.
Y/Y % Change in US TV Prices (RHS) and LCD TV Panel Prices (LHS, 4 Month Lag)
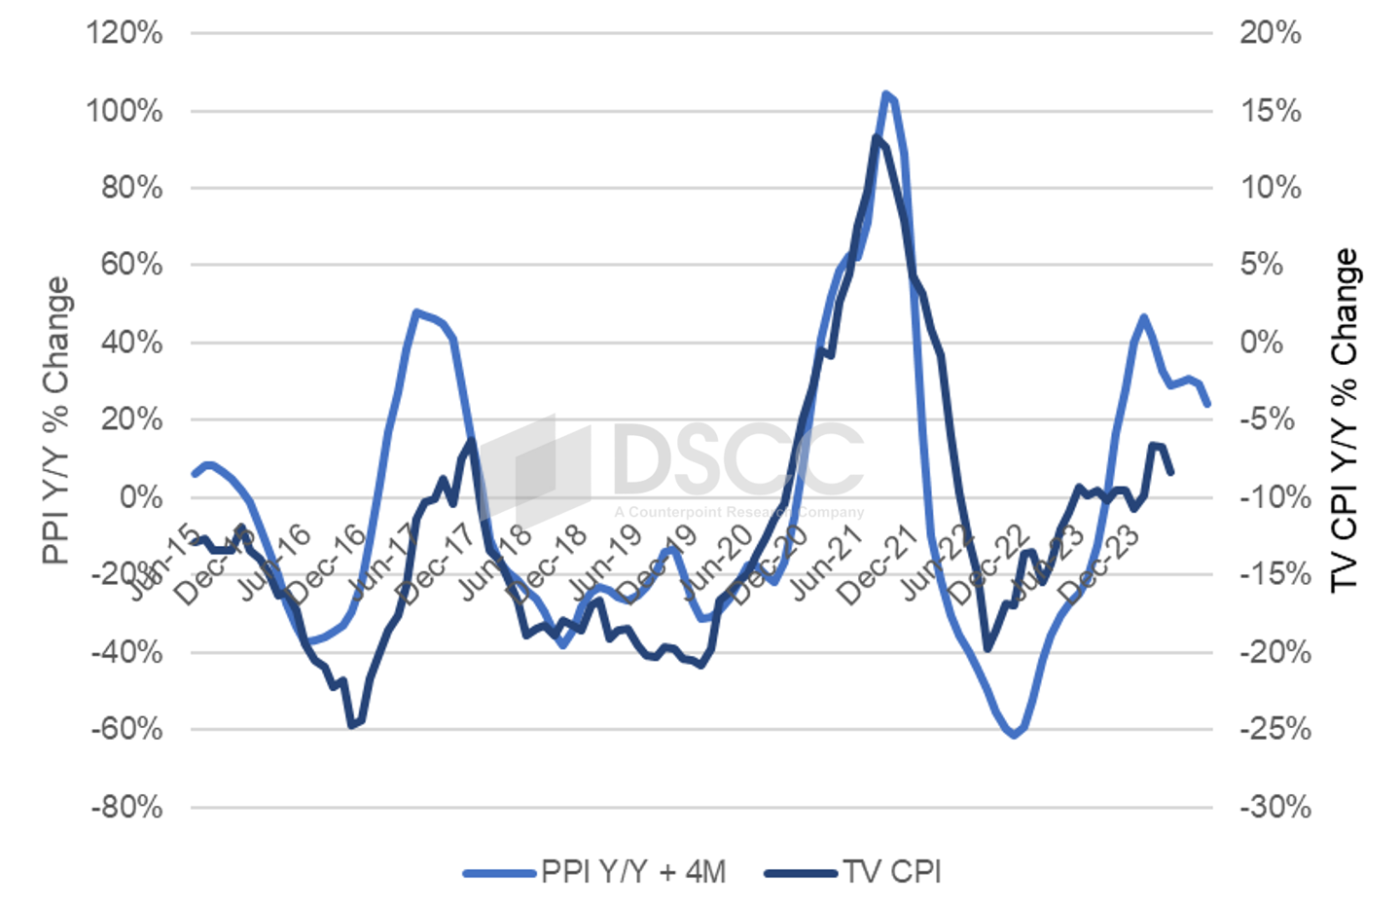
Inflation for TV prices in the US is not expected to have a strong effect on demand, based on the historical example – past examples of TV deflation did not lead to a surge in demand in the US. The increase in LCD TV panel prices in 2023 is consistent with the sequential price increases in the fourth quarter of 2023 and the first two months of 2024, and our regression suggests that TV prices are more likely to decline in the coming months than they are to increase.